After Bell Investing

After Bell Investing · Stock of the Day

2026-10-23

Three large-cap Yahoo day gainers. Market cap ≥ $10B, US listing, real volume. Same pattern readings as the Mag7 print. Filed as a note beside the print. A one-day move is not a call. VIX 19.45 low. SPY 759.97.

1

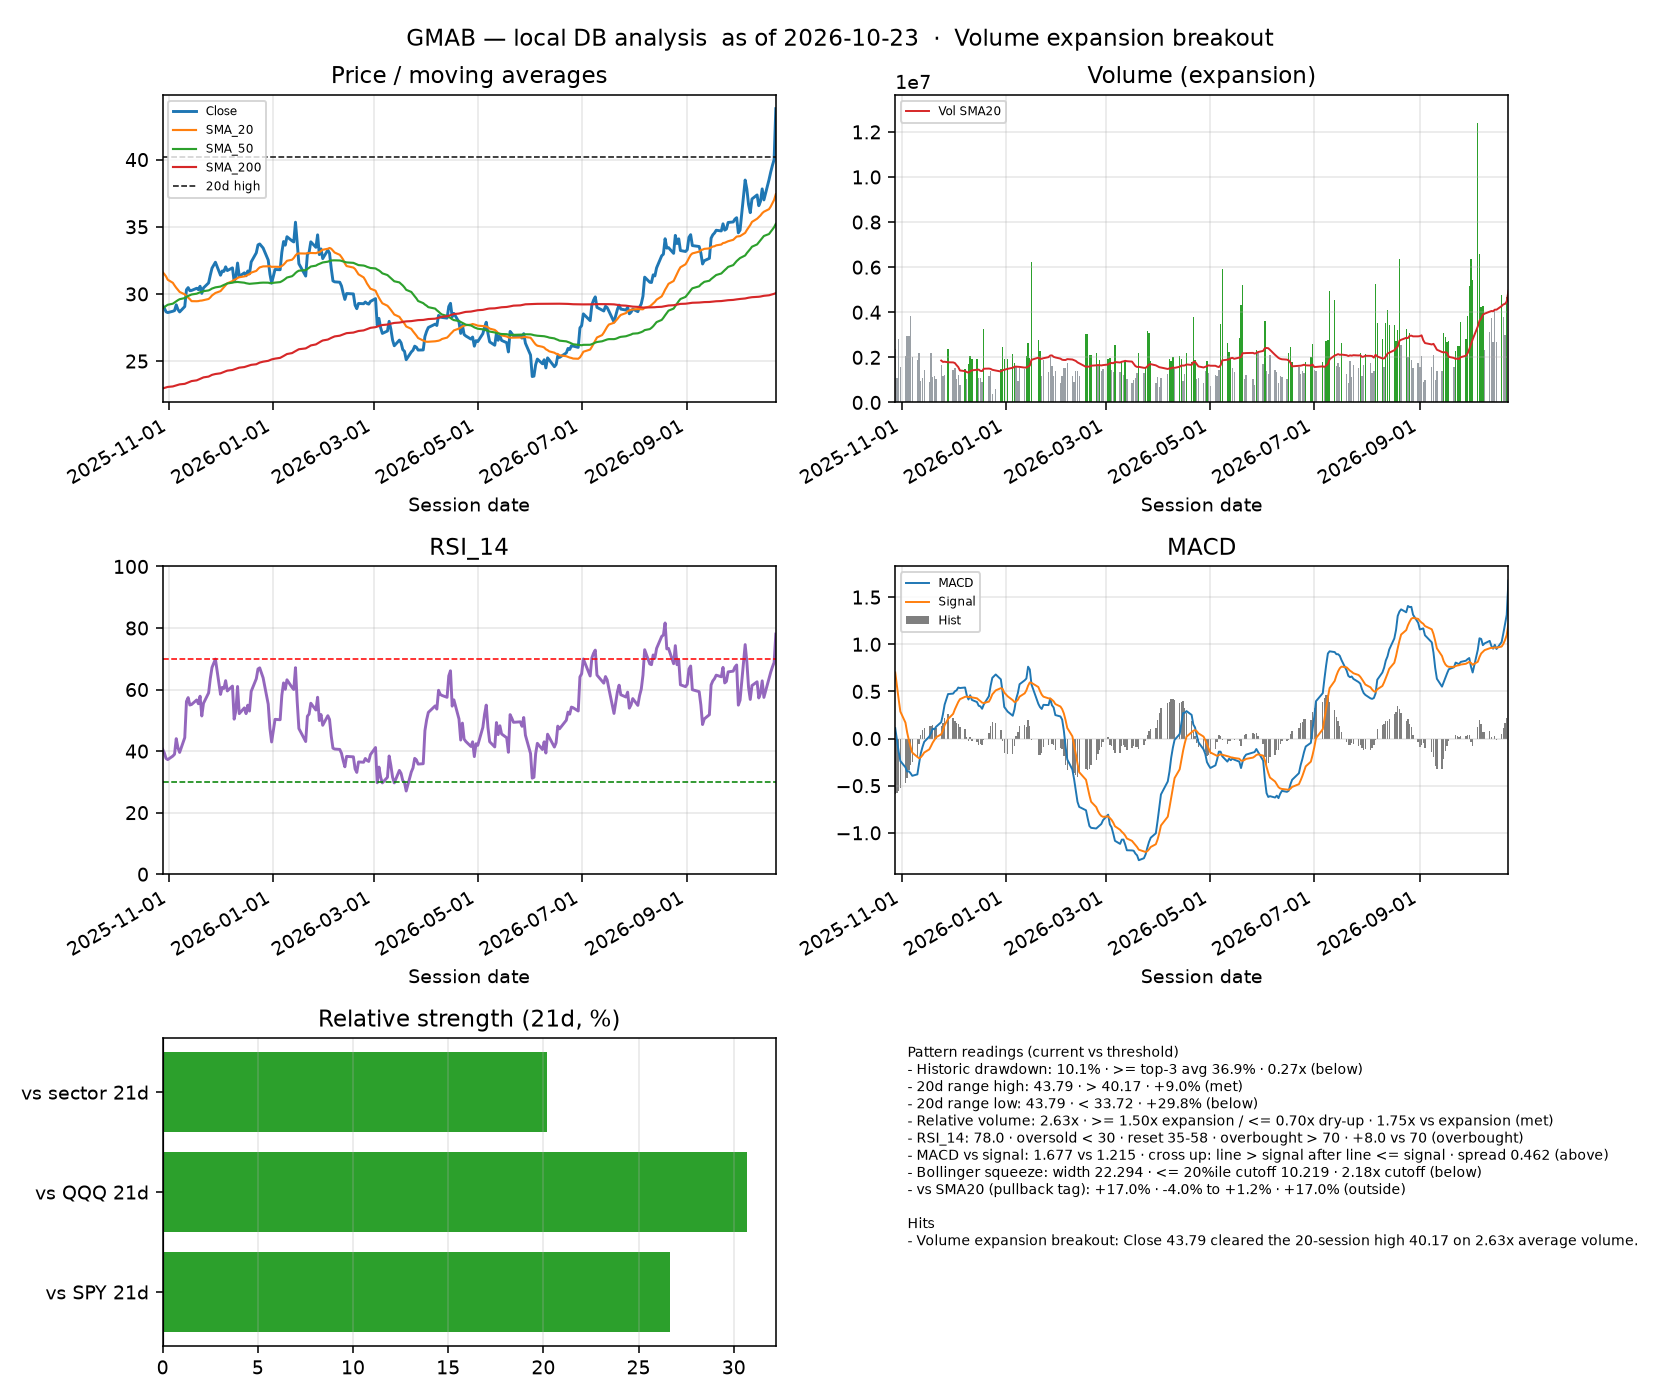
GMAB Genmab A/S

+9.5%

Cap
$26.9B
Last
43.79
RSI 14
78.0
vs SMA20
+17.0%

Named setup breakout · 85/100 · buy

Failed breakout if close back below prior 52w high and stop ~40.90.

Pattern readings

PatternCurrentThresholdvsStatus
Historic drawdown 10.1% >= top-3 avg 36.9% 0.27x below
20d range high 43.79 > 40.17 +9.0% met
20d range low 43.79 < 33.72 +29.8% below
Relative volume 2.63x >= 1.50x expansion / <= 0.70x dry-up 1.75x vs expansion met
RSI_14 78.0 oversold < 30 · reset 35-58 · overbought > 70 +8.0 vs 70 overbought
MACD vs signal 1.677 vs 1.215 cross up: line > signal after line <= signal spread 0.462 above
Bollinger squeeze width 22.294 <= 20%ile cutoff 10.219 2.18x cutoff below
vs SMA20 (pullback tag) +17.0% -4.0% to +1.2% +17.0% outside
vs 52w high (breakout) -1.2% >= -3.0% (within 3% of high) -1.2% met
SMA50 vs SMA200 35.22 vs 30.06 golden: 50 > 200 · death: 50 < 200 +17.2% above
VIX 19.45 (low) elevated >= 20 · stress >= 30 19.45 low
GMAB dashboard

2

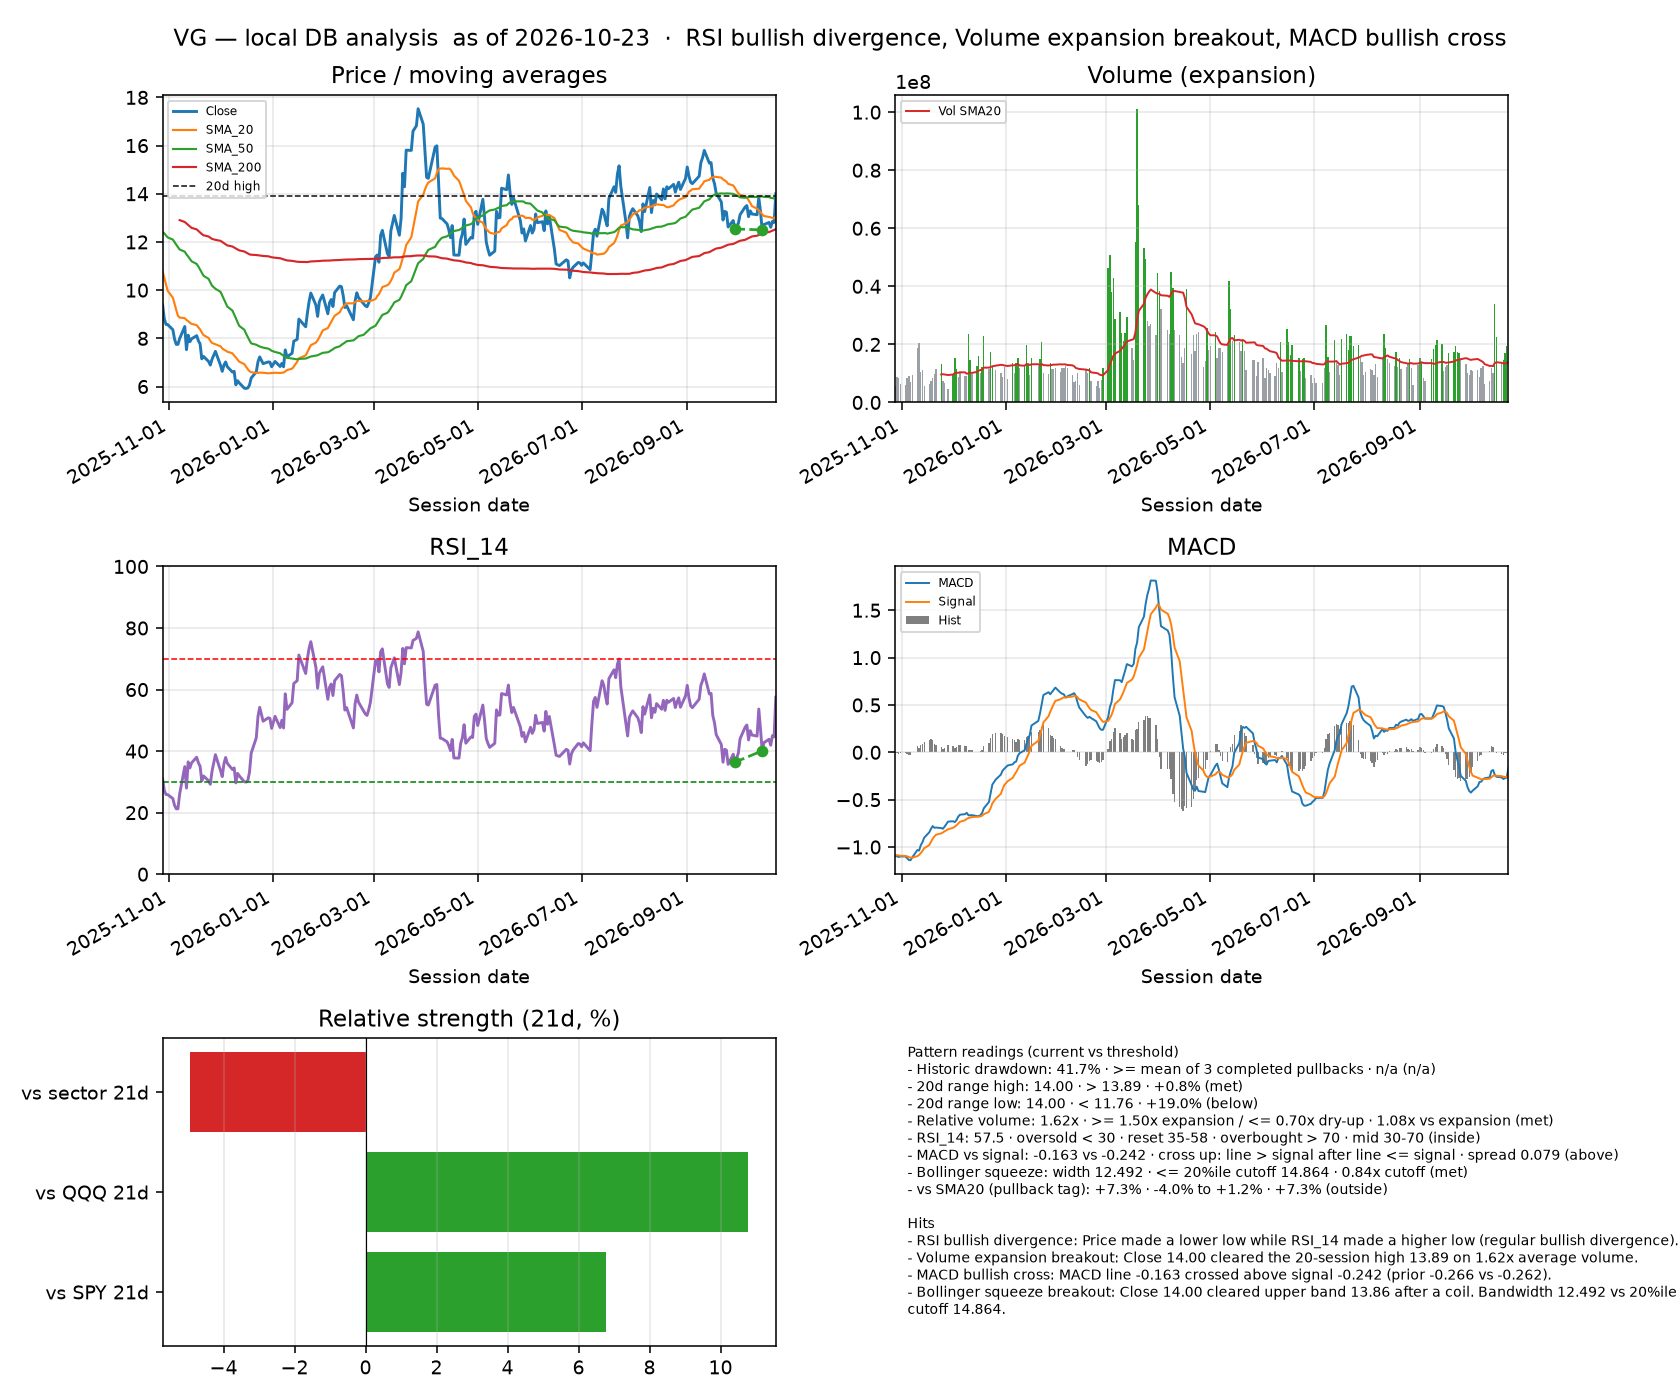
VG Venture Global, Inc.

+9.3%

Cap
$35.0B
Last
14.00
RSI 14
57.5
vs SMA20
+7.3%

Named setup squeeze breakout · 86/100 · buy

Back inside the band / stop ~12.52.

Pattern readings

PatternCurrentThresholdvsStatus
Historic drawdown 41.7% >= mean of 3 completed pullbacks n/a n/a
20d range high 14.00 > 13.89 +0.8% met
20d range low 14.00 < 11.76 +19.0% below
Relative volume 1.62x >= 1.50x expansion / <= 0.70x dry-up 1.08x vs expansion met
RSI_14 57.5 oversold < 30 · reset 35-58 · overbought > 70 mid 30-70 inside
MACD vs signal -0.163 vs -0.242 cross up: line > signal after line <= signal spread 0.079 above
Bollinger squeeze width 12.492 <= 20%ile cutoff 14.864 0.84x cutoff met
vs SMA20 (pullback tag) +7.3% -4.0% to +1.2% +7.3% outside
vs 52w high (breakout) -20.5% >= -3.0% (within 3% of high) -20.5% below
SMA50 vs SMA200 13.81 vs 12.53 golden: 50 > 200 · death: 50 < 200 +10.2% above
VIX 19.45 (low) elevated >= 20 · stress >= 30 19.45 low
RSI bullish divergence price 12.54 → 12.50 · osc 36.38 → 40.10 price lower low AND oscillator higher low price -0.3% · osc +3.72 met
VG dashboard

3

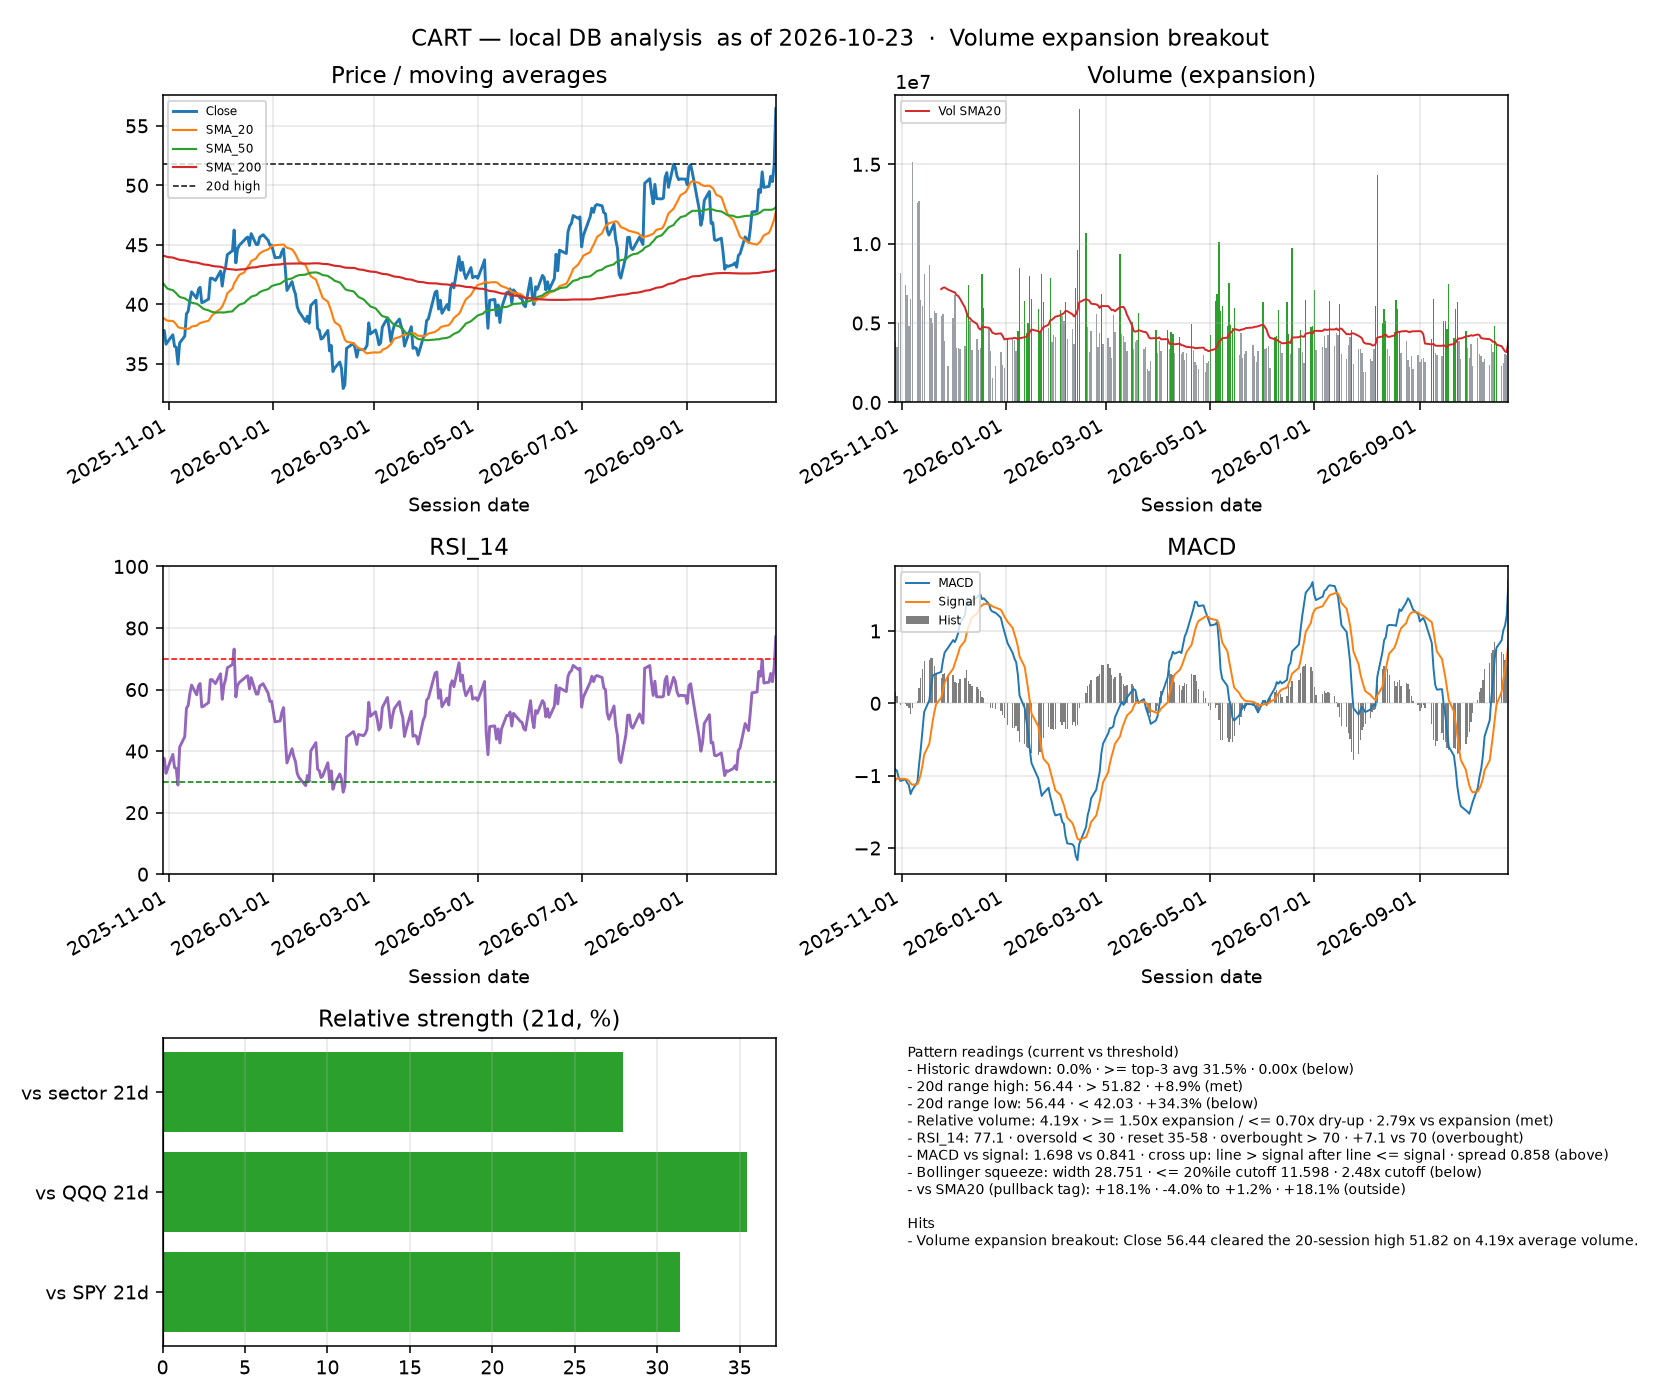
CART Maplebear Inc.

+9.2%

Cap
$13.4B
Last
56.44
RSI 14
77.1
vs SMA20
+18.1%

Named setup breakout · 85/100 · buy

Failed breakout if close back below prior 52w high and stop ~52.43.

Pattern readings

PatternCurrentThresholdvsStatus
Historic drawdown 0.0% >= top-3 avg 31.5% 0.00x below
20d range high 56.44 > 51.82 +8.9% met
20d range low 56.44 < 42.03 +34.3% below
Relative volume 4.19x >= 1.50x expansion / <= 0.70x dry-up 2.79x vs expansion met
RSI_14 77.1 oversold < 30 · reset 35-58 · overbought > 70 +7.1 vs 70 overbought
MACD vs signal 1.698 vs 0.841 cross up: line > signal after line <= signal spread 0.858 above
Bollinger squeeze width 28.751 <= 20%ile cutoff 11.598 2.48x cutoff below
vs SMA20 (pullback tag) +18.1% -4.0% to +1.2% +18.1% outside
vs 52w high (breakout) -2.7% >= -3.0% (within 3% of high) -2.7% met
SMA50 vs SMA200 48.16 vs 42.90 golden: 50 > 200 · death: 50 < 200 +12.3% above
VIX 19.45 (low) elevated >= 20 · stress >= 30 19.45 low
CART dashboard

Named-setup analog on these three

Research analog, not a forecast. Close-to-close after the first session a named setup clears min_score. Onsets are at least 21 sessions apart. A win on a buy is a higher close 21 sessions later, net of 10 bps. A win on a sell is a lower close. Hit rate is always shown next to the same names' unconditional 21-session rate. Mag7 thresholds (n ≥ 40, n_eff ≥ 40) are reported for comparability, but this walk can never earn a cleared grade: on one name n_eff equals n by construction, so read n_episodes — onsets grouped into quarter-wide windows — as the independence count. One long drawdown re-arms a washout setup every quarter and shows up as many onsets. The names were also selected because they jumped today, and the $10B floor is measured today while the history covers the era when the name was far smaller.

Lookback 2300 sessions · onset gap 21 · tape VG 440 · GMAB 2300 · CART 778

Premise check: buying this name after a big up day

The page picks names because they jumped. This is that entry on each name's own history — not a named setup.

Nameup day ≥nepisodes21d netbasevs SPYbeat SPY
VG 8% 9 4 44.4% 45.6% +7.3% 44.4%
GMAB 8% 4 3 75.0% 53.5% +0.2% 50.0%
CART 8% 5 5 60.0% 55.1% -1.0% 40.0%

Today's printed setups

NameSetupSidenn_effepisodes21d netbasevs SPYbeat SPYbase beatverdict
GMAB breakout buy 27 27.0 14 55.6% 53.5% -0.6% 44.4% 48.7% fail
VG squeeze_breakout buy 2 2.0 2 50.0% 45.6% +14.6% 50.0% 42.5% fail
CART breakout buy 5 5.0 3 20.0% 55.1% -6.4% 20.0% 51.7% fail

Whole-panel walk

SetupSidenn_effepisodes21d netbasevs SPYbeat SPYbase beatverdict
pullback_in_uptrend buy 50 45.0 22 50.0% 52.9% -1.6% 46.0% 48.6% fail
pullback_and_rs buy 46 41.0 20 50.0% 52.9% -1.7% 45.7% 48.6% fail
cheap_vs_industry buy 0 0.0 0 — 52.9% — — 48.6% fail
breakout buy 33 32.0 17 48.5% 52.9% -2.4% 39.4% 48.6% fail
golden_cross buy 10 10.0 8 40.0% 52.9% -2.8% 40.0% 48.6% fail
bullish_divergence buy 6 6.0 5 83.3% 52.9% +0.5% 50.0% 48.6% fail
volume_breakout buy 28 24.0 17 46.4% 52.9% +0.2% 39.3% 48.6% fail
squeeze_breakout buy 20 19.0 12 55.0% 52.9% +1.7% 60.0% 48.6% fail
historic_drawdown buy 17 15.0 11 47.1% 52.9% +2.2% 35.3% 48.6% fail
deep_drawdown_value buy 7 7.0 3 28.6% 52.9% -0.6% 42.9% 48.6% fail
death_cross sell 9 9.0 9 55.6% 46.3% +2.6% 55.6% 51.4% fail
bearish_divergence sell 2 2.0 2 0.0% 46.3% -42.6% 0.0% 51.4% fail
breakdown sell 25 24.0 13 48.0% 46.3% -3.2% 52.0% 51.4% fail
volume_breakdown sell 23 23.0 16 47.8% 46.3% -1.2% 39.1% 51.4% fail
squeeze_breakdown sell 19 19.0 14 52.6% 46.3% +1.0% 57.9% 51.4% fail
bounce_in_downtrend sell 39 37.0 18 53.8% 46.3% -1.6% 53.8% 51.4% fail

CART

SetupSidenn_effepisodes21d netbasevs SPYbeat SPYbase beatverdict
pullback_in_uptrend buy 14 14.0 7 42.9% 55.1% +0.1% 42.9% 51.7% fail
pullback_and_rs buy 13 13.0 6 38.5% 55.1% -1.2% 30.8% 51.7% fail
cheap_vs_industry buy 0 0.0 0 — 55.1% — — 51.7% fail
breakout buy 5 5.0 3 20.0% 55.1% -6.4% 20.0% 51.7% fail
golden_cross buy 2 2.0 2 50.0% 55.1% +5.7% 50.0% 51.7% fail
bullish_divergence buy 0 0.0 0 — 55.1% — — 51.7% fail
volume_breakout buy 5 5.0 4 20.0% 55.1% -8.5% 20.0% 51.7% fail
squeeze_breakout buy 4 4.0 2 50.0% 55.1% -3.8% 50.0% 51.7% fail
historic_drawdown buy 5 5.0 4 40.0% 55.1% -0.1% 40.0% 51.7% fail
deep_drawdown_value buy 2 2.0 1 50.0% 55.1% +6.5% 50.0% 51.7% fail
death_cross sell 2 2.0 2 50.0% 44.3% +1.6% 50.0% 48.3% fail
bearish_divergence sell 0 0.0 0 — 44.3% — — 48.3% fail
breakdown sell 2 2.0 1 0.0% 44.3% -19.1% 0.0% 48.3% fail
volume_breakdown sell 3 3.0 3 66.7% 44.3% +2.2% 33.3% 48.3% fail
squeeze_breakdown sell 3 3.0 2 66.7% 44.3% +1.5% 66.7% 48.3% fail
bounce_in_downtrend sell 3 3.0 2 66.7% 44.3% -2.6% 33.3% 48.3% fail

GMAB

SetupSidenn_effepisodes21d netbasevs SPYbeat SPYbase beatverdict
pullback_in_uptrend buy 32 32.0 17 53.1% 53.5% -1.3% 50.0% 48.7% fail
pullback_and_rs buy 29 29.0 15 58.6% 53.5% -0.4% 55.2% 48.7% fail
cheap_vs_industry buy 0 0.0 0 — 53.5% — — 48.7% fail
breakout buy 27 27.0 14 55.6% 53.5% -0.6% 44.4% 48.7% fail
golden_cross buy 7 7.0 7 42.9% 53.5% -1.8% 42.9% 48.7% fail
bullish_divergence buy 5 5.0 4 80.0% 53.5% +0.9% 60.0% 48.7% fail
volume_breakout buy 20 20.0 15 50.0% 53.5% -0.5% 40.0% 48.7% fail
squeeze_breakout buy 14 14.0 11 57.1% 53.5% +1.4% 64.3% 48.7% fail
historic_drawdown buy 9 9.0 8 55.6% 53.5% -3.1% 33.3% 48.7% fail
deep_drawdown_value buy 5 5.0 2 20.0% 53.5% -3.4% 40.0% 48.7% fail
death_cross sell 7 7.0 7 57.1% 45.6% +2.9% 57.1% 51.3% fail
bearish_divergence sell 1 1.0 1 0.0% 45.6% -12.8% 0.0% 51.3% fail
breakdown sell 21 21.0 12 52.4% 45.6% -1.3% 57.1% 51.3% fail
volume_breakdown sell 19 19.0 14 47.4% 45.6% -1.5% 42.1% 51.3% fail
squeeze_breakdown sell 16 16.0 12 50.0% 45.6% +1.0% 56.2% 51.3% fail
bounce_in_downtrend sell 34 34.0 17 55.9% 45.6% +0.5% 58.8% 51.3% fail

VG

SetupSidenn_effepisodes21d netbasevs SPYbeat SPYbase beatverdict
pullback_in_uptrend buy 4 4.0 2 50.0% 45.6% -9.8% 25.0% 42.5% fail
pullback_and_rs buy 4 4.0 2 25.0% 45.6% -13.0% 25.0% 42.5% fail
cheap_vs_industry buy 0 0.0 0 — 45.6% — — 42.5% fail
breakout buy 1 1.0 1 0.0% 45.6% -30.2% 0.0% 42.5% fail
golden_cross buy 1 1.0 1 0.0% 45.6% -26.3% 0.0% 42.5% fail
bullish_divergence buy 1 1.0 1 100.0% 45.6% -1.4% 0.0% 42.5% fail
volume_breakout buy 3 3.0 2 66.7% 45.6% +19.7% 66.7% 42.5% fail
squeeze_breakout buy 2 2.0 2 50.0% 45.6% +14.6% 50.0% 42.5% fail
historic_drawdown buy 3 3.0 2 33.3% 45.6% +22.0% 33.3% 42.5% fail
deep_drawdown_value buy 0 0.0 0 — 45.6% — — 42.5% fail
death_cross sell 0 0.0 0 — 54.2% — — 57.5% fail
bearish_divergence sell 1 1.0 1 0.0% 54.2% -72.5% 0.0% 57.5% fail
breakdown sell 2 2.0 1 50.0% 54.2% -7.3% 50.0% 57.5% fail
volume_breakdown sell 1 1.0 1 0.0% 54.2% -5.9% 0.0% 57.5% fail
squeeze_breakdown sell 0 0.0 0 — 54.2% — — 57.5% fail
bounce_in_downtrend sell 2 2.0 1 0.0% 54.2% -35.5% 0.0% 57.5% fail

Earlier mover prints

  1. SPOT · ALLE · WCN · 3 cards
  2. SMCI · CRL · ZS · 3 cards
  3. TLK · EFX · HAS · 3 cards
  4. FROG · SMMT · RMBS · 3 cards
  5. AR · OVV · EQNR · 3 cards
  6. ERIC · TRU · CRCL · 3 cards
  7. HALO · GFS · UNH · 3 cards
  8. CDW · VG · INFY · 3 cards
  9. FICO · MANH · FRO · 3 cards
  10. CCI · MRNA · HUM · 3 cards
  11. CSGP · FLUT · PBF · 3 cards
  12. BSP · GKOS · SPOT · 3 cards
  13. CIEN · TLN · CEG · 3 cards
  14. PTC · XP · PCVX · 3 cards
  15. IBRX · INIO · FPS · 3 cards