
Close print
2026-10-23
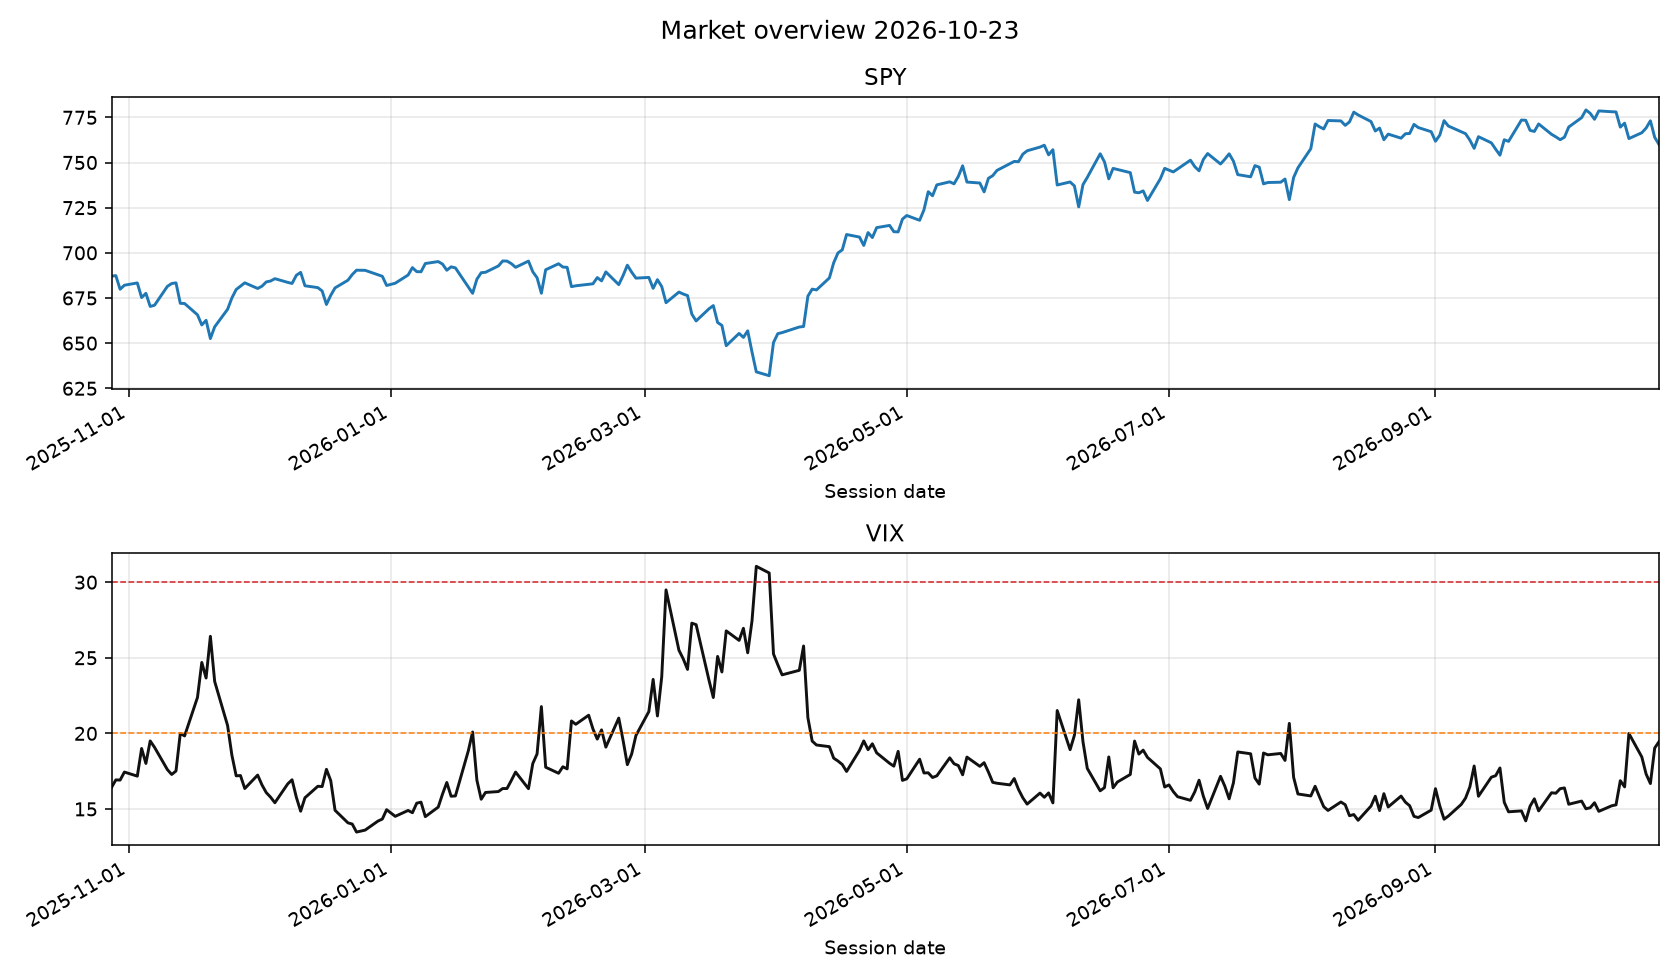
- VIX 19.45 low
- SPY 759.97
- 1 named setup
Research record of this close. Not a buy or sell instruction.
Desk take
Close print for 2026-10-23. VIX 19.45 (low) and SPY 759.97 set the tape. Hybrid desk: the scanner names the setup, the model grades that same print, and published conviction is the blend. The model cannot add a name that did not fire.
Amazon.com, Inc. (AMZN)
Scanner what happened: AMZN traded cheaper than its industry peers on trailing P/E at 87/100 (setup 100).
Why it printed:
- Trailing P/E 20.0 is below the internet retail / big-box peer median 32.0 (38% cheaper).
- Market cap still sits above the peer median ($2.68T vs $381.9B).
- Cap is more than 2× the peer median — quality/size filter.
- VIX regime is low (19.45).
- 21d relative strength vs SPY is 0.4%.
Invalidation: Multiple re-rates up to the peer median P/E, or a daily close back below SMA200; stop ~234.67.
Continuation of the 2026-10-22 alert, not a new one — this is print 8 of one run: the same call has gone out 7 times since 2026-10-14 across 9 calendar days, most recently on 2026-10-22. Today is not a fresh signal; the setup was already true when the desk last printed it. The analog below measures the first session of a run, so its hit rate belongs to 2026-10-14, not to today.
Same-setup analogs on 21 names (n=266, n_eff=86.5, 95% CI 47–68%): 58% 21-session net hit rate against a 59% base rate, average +3.0%, vs SPY +1.3%.
The 95% interval includes 50%, so this is the desk's narrative setup rather than a demonstrated edge.
LLM confirm at 87/100: Amazon presents a strong cheap_vs_industry setup with a trailing P/E well below its peer median alongside massive market cap dominance. The low VIX regime and steady relative strength support building exposure here. Invalidation sits cleanly below the SMA200 or via valuation re-rate.
Risk: A sudden contraction in retail peer multiples could compress the valuation gap prematurely.
Taiwan Semiconductor (TSM)
Scanner what happened: TSM traded cheaper than its industry peers on trailing P/E at 78/100 (setup 98).
Why it printed:
- Trailing P/E 26.9 is below the semiconductors peer median 46.4 (42% cheaper).
- Market cap still sits above the peer median ($2.17T vs $843.6B).
- Cap is more than 2× the peer median — quality/size filter.
- VIX regime is low (19.45).
- Relative volume 0.83x.
Invalidation: Multiple re-rates up to the peer median P/E, or a daily close back below SMA200; stop ~392.90.
Continuation of the 2026-10-21 alert, not a new one — this is print 11 of one run: the same call has gone out 10 times since 2026-10-07 across 16 calendar days, most recently on 2026-10-21. Today is not a fresh signal; the setup was already true when the desk last printed it. The analog below measures the first session of a run, so its hit rate belongs to 2026-10-07, not to today.
Same-setup analogs on 21 names (n=266, n_eff=86.5, 95% CI 47–68%): 58% 21-session net hit rate against a 59% base rate, average +3.0%, vs SPY +1.3%.
The 95% interval includes 50%, so this is the desk's narrative setup rather than a demonstrated edge.
LLM confirm at 78/100: Taiwan Semiconductor offers a compelling valuation discount relative to the semiconductor peer group while maintaining exceptional scale. Though short-term relative strength is lagging slightly, the low VIX environment provides a favorable backdrop for accumulation. The multi-print repetition signals sustained interest.
Risk: Geopolitical friction or supply chain disruptions could invalidate the expected multiple expansion.
KLA (KLAC)
Scanner what happened: KLAC sat in a deep drawdown during VIX stress at 72/100 (setup 90).
Why it printed:
- Close is -52.6% from the 52-week high — a deep drawdown.
- Drawdown reaches 35% from the high.
- Drawdown reaches 50% from the high.
- Drawdown is at least the mean of this name's largest completed pullbacks (37.9%).
- RSI_14=23.3 is washed out.
- TTM EPS is still growing through the drawdown (12.9% YoY).
Invalidation: Stop ~129.49 (2x ATR) or TTM earnings turning negative.
Continuation of the 2026-10-13 alert, not a new one — this is print 2 of one run: the same call went out on 2026-10-13. Today is not a fresh signal; the setup was already true when the desk last printed it. The analog below measures the first session of a run, so its hit rate belongs to 2026-10-13, not to today.
Same-setup analogs on 21 names (n=221, n_eff=58.2, 95% CI 50–74%): 63% 21-session net hit rate against a 59% base rate, average +3.6%, vs SPY +1.4%.
The 95% interval includes 50%, so this is the desk's narrative setup rather than a demonstrated edge.
LLM confirm at 72/100: KLA displays a textbook deep_drawdown_value washout buy with an extremely oversold RSI and a decline exceeding historical pullback averages. Ongoing year-over-year EPS growth through the drawdown validates the fundamental integrity of the business. The setup is sound for a mean-reversion bounce.
Risk: Prolonged weakness in fab equipment spending could extend the drawdown below the 2x ATR stop.
Texas Instruments (TXN)
Scanner what happened: TXN pulled back to its 20-day average inside an uptrend at 72/100 (setup 90).
Why it printed:
- Price above SMA50 and SMA50 above SMA200 (bullish regime).
- VIX regime is low (19.45).
- RSI_14=55.1 is a reset, not a chase.
- Close is 0.3% from SMA20 (pullback/tag).
- 21d relative strength vs SPY is 6.1%.
- Relative volume 1.21x.
Invalidation: Stop ~266.34 (2x ATR) or daily close back below SMA50.
Continuation of the 2026-10-14 alert, not a new one — this is print 2 of one run: the same call went out on 2026-10-14. Today is not a fresh signal; the setup was already true when the desk last printed it. The analog below measures the first session of a run, so its hit rate belongs to 2026-10-14, not to today.
Same-setup analogs on 21 names (n=1022, n_eff=114.4, 95% CI 51–68%): 60% 21-session net hit rate against a 59% base rate, average +2.8%, vs SPY +1.5%.
The 95% interval includes 50%, so this is the desk's narrative setup rather than a demonstrated edge.
LLM confirm at 72/100: Texas Instruments maintains a healthy pullback_in_uptrend setup supported by a robust moving average stack and positive relative strength. An RSI near 55 reflects a clean price reset rather than an exhausted chase. Elevated relative volume confirms active institutional participation.
Risk: Broader semiconductor sector rotation could pull the price back below the SMA50 support level.
Alphabet Inc. (GOOGL)
Scanner what happened: GOOGL traded cheaper than its industry peers on trailing P/E at 68/100 (setup 87).
Why it printed:
- Trailing P/E 16.1 is below the interactive media peer median 18.6 (14% cheaper).
- Market cap still sits above the peer median ($1.88T vs $11.0B).
- Cap is more than 2× the peer median — quality/size filter.
- VIX regime is low (19.45).
Invalidation: Multiple re-rates up to the peer median P/E, or a daily close back below SMA200; stop ~303.01.
Same-setup analogs on 21 names (n=266, n_eff=86.5, 95% CI 47–68%): 58% 21-session net hit rate against a 59% base rate, average +3.0%, vs SPY +1.3%.
The 95% interval includes 50%, so this is the desk's narrative setup rather than a demonstrated edge.
LLM haircut at 68/100: Alphabet meets the numerical thresholds for the cheap_vs_industry setup with a modest discount to its interactive media peers. However, negative 21-day relative strength and subdued volume suggest a lack of immediate upside catalyst. The setup is acceptable but lacks the urgency of top-tier peers.
Risk: Persistent underperformance against the broader market could trigger further sideways drift.
NVIDIA Corporation (NVDA)
Scanner what happened: NVDA traded cheaper than its industry peers on trailing P/E at 69/100 (setup 86).
Why it printed:
- Trailing P/E 30.1 is below the semiconductors peer median 34.6 (13% cheaper).
- Market cap still sits above the peer median ($5.09T vs $843.6B).
- Cap is more than 2× the peer median — quality/size filter.
- VIX regime is low (19.45).
Invalidation: Multiple re-rates up to the peer median P/E, or a daily close back below SMA200; stop ~198.84.
Continuation of the 2026-10-19 alert, not a new one — this is print 13 of one run: the same call has gone out 12 times since 2026-10-02 across 21 calendar days, most recently on 2026-10-19. Today is not a fresh signal; the setup was already true when the desk last printed it. The analog below measures the first session of a run, so its hit rate belongs to 2026-10-02, not to today.
Same-setup analogs on 21 names (n=266, n_eff=86.5, 95% CI 47–68%): 58% 21-session net hit rate against a 59% base rate, average +3.0%, vs SPY +1.3%.
The 95% interval includes 50%, so this is the desk's narrative setup rather than a demonstrated edge.
LLM haircut at 69/100: NVIDIA qualifies under the cheap_vs_industry framework with a slight P/E discount relative to semiconductor peers paired with industry-leading market cap. The negative 21-day relative strength and low relative volume temper immediate enthusiasm. It remains a quality name experiencing a temporary growth-at-a-discount phase.
Risk: Failure to hold above the defined stop could lead to a deeper consolidation phase.
Microsoft Corporation (MSFT)
Scanner what happened: MSFT pulled back to its 20-day average inside an uptrend at 68/100 (setup 85).
Why it printed:
- Price above SMA50 and SMA50 above SMA200 (bullish regime).
- VIX regime is low (19.45).
- RSI_14=52.6 is a reset, not a chase.
- Close is -0.4% from SMA20 (pullback/tag).
- 21d relative strength vs SPY is 6.3%.
Invalidation: Stop ~501.95 (2x ATR) or daily close back below SMA50.
Same-setup analogs on 21 names (n=1022, n_eff=114.4, 95% CI 51–68%): 60% 21-session net hit rate against a 59% base rate, average +2.8%, vs SPY +1.5%.
The 95% interval includes 50%, so this is the desk's narrative setup rather than a demonstrated edge.
LLM confirm at 68/100: Microsoft demonstrates a reliable pullback_in_uptrend structure with price tagging the SMA20 within a firmly bullish regime. Positive relative strength over the past month underscores underlying demand despite low daily volume. The setup offers a clean risk-defined entry.
Risk: A general de-risking in mega-cap technology could break the underlying SMA50 trend support.
Analog Devices (ADI)
Scanner what happened: ADI pulled back to its 20-day average inside an uptrend at 68/100 (setup 85).
Why it printed:
- Price above SMA50 and SMA50 above SMA200 (bullish regime).
- VIX regime is low (19.45).
- RSI_14=47.3 is a reset, not a chase.
- Close is -3.1% from SMA20 (pullback/tag).
- 21d relative strength vs SPY is 3.2%.
Invalidation: Stop ~365.08 (2x ATR) or daily close back below SMA50.
Same-setup analogs on 21 names (n=1022, n_eff=114.4, 95% CI 51–68%): 60% 21-session net hit rate against a 59% base rate, average +2.8%, vs SPY +1.5%.
The 95% interval includes 50%, so this is the desk's narrative setup rather than a demonstrated edge.
LLM confirm at 68/100: Analog Devices sets up well as a pullback_in_uptrend within a structurally sound moving average hierarchy. An RSI near 47 provides an ideal reset for continuation alongside positive relative strength. The modest dip below the SMA20 offers a favorable tactical entry.
Risk: Cyclical downturns in industrial semiconductor demand could delay the resumption of the primary trend.
Micron Technology (MU)
Scanner what happened: MU traded cheaper than its industry peers on trailing P/E at 68/100 (setup 85).
Why it printed:
- Trailing P/E 11.6 is below the semiconductors peer median 58.4 (80% cheaper).
- Market cap still sits above the peer median ($992.9B vs $651.7B).
- VIX regime is low (19.45).
Invalidation: Multiple re-rates up to the peer median P/E, or a daily close back below SMA200; stop ~781.86.
Continuation of the 2026-10-15 alert, not a new one — this is print 11 of one run: the same call has gone out 10 times since 2026-10-02 across 21 calendar days, most recently on 2026-10-15. Today is not a fresh signal; the setup was already true when the desk last printed it. The analog below measures the first session of a run, so its hit rate belongs to 2026-10-02, not to today.
Same-setup analogs on 21 names (n=266, n_eff=86.5, 95% CI 47–68%): 58% 21-session net hit rate against a 59% base rate, average +3.0%, vs SPY +1.3%.
The 95% interval includes 50%, so this is the desk's narrative setup rather than a demonstrated edge.
LLM haircut at 68/100: Micron offers a substantial P/E discount relative to semiconductor peers, satisfying the cheap_vs_industry criteria cleanly. However, severe negative relative strength indicates persistent selling pressure that argues against aggressive sizing. Patience is warranted until price momentum stabilizes.
Risk: Cyclical memory pricing downturns can keep deeply discounted stocks under pressure longer than anticipated.
Applied Materials (AMAT)
Scanner what happened: AMAT traded cheaper than its industry peers on trailing P/E at 65/100 (setup 81).
Why it printed:
- Trailing P/E 34.6 is below the semiconductor equipment peer median 38.7 (11% cheaper).
- Market cap still sits above the peer median ($299.4B vs $288.0B).
- VIX regime is low (19.45).
- Relative volume 0.99x.
Invalidation: Multiple re-rates up to the peer median P/E, or a daily close back below SMA200; stop ~337.55.
Continuation of the 2026-10-12 alert, not a new one — this is print 6 of one run: the same call has gone out 5 times since 2026-10-06 across 17 calendar days, most recently on 2026-10-12. Today is not a fresh signal; the setup was already true when the desk last printed it. The analog below measures the first session of a run, so its hit rate belongs to 2026-10-06, not to today.
Same-setup analogs on 21 names (n=266, n_eff=86.5, 95% CI 47–68%): 58% 21-session net hit rate against a 59% base rate, average +3.0%, vs SPY +1.3%.
The 95% interval includes 50%, so this is the desk's narrative setup rather than a demonstrated edge.
LLM haircut at 65/100: Applied Materials qualifies for the cheap_vs_industry setup with a modest valuation discount and massive scale. The heavily oversold RSI and weak 21-day relative strength point to a name undergoing significant corrective drag. It is tradable but requires strict adherence to the stop level.
Risk: Subdued relative volume and heavy underperformance increase the risk of a false recovery signal.
Lam Research (LRCX)
Scanner what happened: LRCX sat in a deep drawdown during VIX stress at 55/100 (setup 68).
Why it printed:
- Close is -47.5% from the 52-week high — a deep drawdown.
- Drawdown reaches 35% from the high.
- RSI_14=24.6 is washed out.
- Trailing P/E is 12% cheaper than the industry-peer median.
- TTM EPS is still growing through the drawdown (48.9% YoY).
Invalidation: Stop ~200.03 (2x ATR) or TTM earnings turning negative.
Same-setup analogs on 21 names (n=221, n_eff=58.2, 95% CI 50–74%): 63% 21-session net hit rate against a 59% base rate, average +3.6%, vs SPY +1.4%.
The 95% interval includes 50%, so this is the desk's narrative setup rather than a demonstrated edge.
LLM wait at 55/100: Lam Research registers a deep_drawdown_value setup featuring a severe decline from highs and washed-out momentum indicators. While TTM EPS growth provides fundamental backing, the steep negative relative strength counsels against forcing exposure. This observation does not warrant immediate action.
Risk: Capital could remain trapped in a protracted base-building period despite attractive valuation metrics.
Apple Inc. (AAPL)
Scanner what happened: AAPL closed near a 52-week high at 53/100 (setup 65).
Why it printed:
- Within 1.1% of 52-week high.
- Still in a bullish SMA regime.
- Beating SPY by 4.5% over 21d.
- VIX regime low.
Invalidation: Failed breakout if close back below prior 52w high and stop ~334.91.
Same-setup analogs on 21 names (n=739, n_eff=101.3, 95% CI 49–67%): 58% 21-session net hit rate against a 59% base rate, average +2.8%, vs SPY +1.7%.
The 95% interval includes 50%, so this is the desk's narrative setup rather than a demonstrated edge.
LLM wait at 53/100: Apple approaches its 52-week high within a strong bullish trend and solid relative performance. The breakout setup is technically valid, but the current reward-to-risk profile near resistance lacks urgency. It is better observed for a confirmed breakout or a deeper constructive pullback.
Risk: A failed breakout right at resistance could quickly trigger a reversion toward moving average support.
Broadcom (AVGO)
Scanner what happened: AVGO sat in a deep drawdown during VIX stress at 49/100 (setup 60).
Why it printed:
- Close is -35.0% from the 52-week high — a deep drawdown.
- Drawdown reaches 35% from the high.
- RSI_14=34.2 is washed out.
- TTM EPS is still growing through the drawdown (29.3% YoY).
Invalidation: Stop ~299.16 (2x ATR) or TTM earnings turning negative.
Same-setup analogs on 21 names (n=221, n_eff=58.2, 95% CI 50–74%): 63% 21-session net hit rate against a 59% base rate, average +3.6%, vs SPY +1.4%.
The 95% interval includes 50%, so this is the desk's narrative setup rather than a demonstrated edge.
LLM wait at 49/100: Broadcom shows a deep_drawdown_value profile with a 35% pullback and an oversold RSI. Despite solid underlying earnings growth, negative relative performance and low relative volume suggest institutional apathy at present. The setup is functional but low-conviction.
Risk: Continued relative weakness against the broader index could push the stock toward its structural stop.
Intel (INTC)
Scanner what happened: INTC sat in a deep drawdown during VIX stress at 49/100 (setup 60).
Why it printed:
- Close is -38.9% from the 52-week high — a deep drawdown.
- Drawdown reaches 35% from the high.
- RSI_14=32.8 is washed out.
- TTM EPS is still growing through the drawdown (179.5% YoY).
Invalidation: Stop ~75.73 (2x ATR) or TTM earnings turning negative.
Same-setup analogs on 21 names (n=221, n_eff=58.2, 95% CI 50–74%): 63% 21-session net hit rate against a 59% base rate, average +3.6%, vs SPY +1.4%.
The 95% interval includes 50%, so this is the desk's narrative setup rather than a demonstrated edge.
LLM oppose at 49/100: Intel triggers a deep_drawdown_value setup based on percentage drop and high earnings growth off a depressed base. However, extreme negative relative strength of over thirty percent makes this a classic value trap rather than a sound buy. Capital is better deployed in stronger sector leaders.
Risk: Structural operational headwinds can easily invalidate technical stop-losses in chronically lagging equities.
Overall: mixed hybrid tape. Read each card's scanner grade, LLM stance, and hybrid conviction separately — not as one market call.
RESEARCH ONLY — not advice.
Skip-month two · DELL · MRNA. Set 2026-10-15.
Named setups
AMZN AMZN traded cheaper than its industry peers on trailing P/E
Close248.00
Stop234.67
Hybrid 87/100 · buy · named setup cheap vs industry
Scanner 87/100 LLM confirm 87/100
Amazon presents a strong cheap_vs_industry setup with a trailing P/E well below its peer median alongside massive market cap dominance. The low VIX regime and steady relative strength support building exposure here. Invalidation sits cleanly below the SMA200 or via valuation re-rate.
Multiple re-rates up to the peer median P/E, or a daily close back below SMA200.
Window Over the measured window — ten years of the local tape, 21 names, onsets spaced so one market phase counts once, and a 10 bps round trip — no named setup beat holding these companies. Result The unconditional 21-session up-rate was 58.67%. On buy-now versus wait through the next 21 sessions, every setup landed between −0.67% and +0.64% against a random session. One setup clears the publish gate: historic_drawdown at a 61.25% net hit rate on 352 onsets, and its 95% interval bottoms out at 50.33% — a third of a point above a coin. How to read Read that as a gate it passed, not an edge it demonstrated. The desk publishes named setups as context — what happened on the tape — not as timing calls. Scheduled accumulation is the default the evidence supports. The 58.67% figure is not an expected future return: the universe is today's survivors chosen after the fact, which inflates the absolute up-rate.
Earnings note for this close.
On the shelf
The public page keeps the latest close and the four before it.