
Close print
2026-10-19
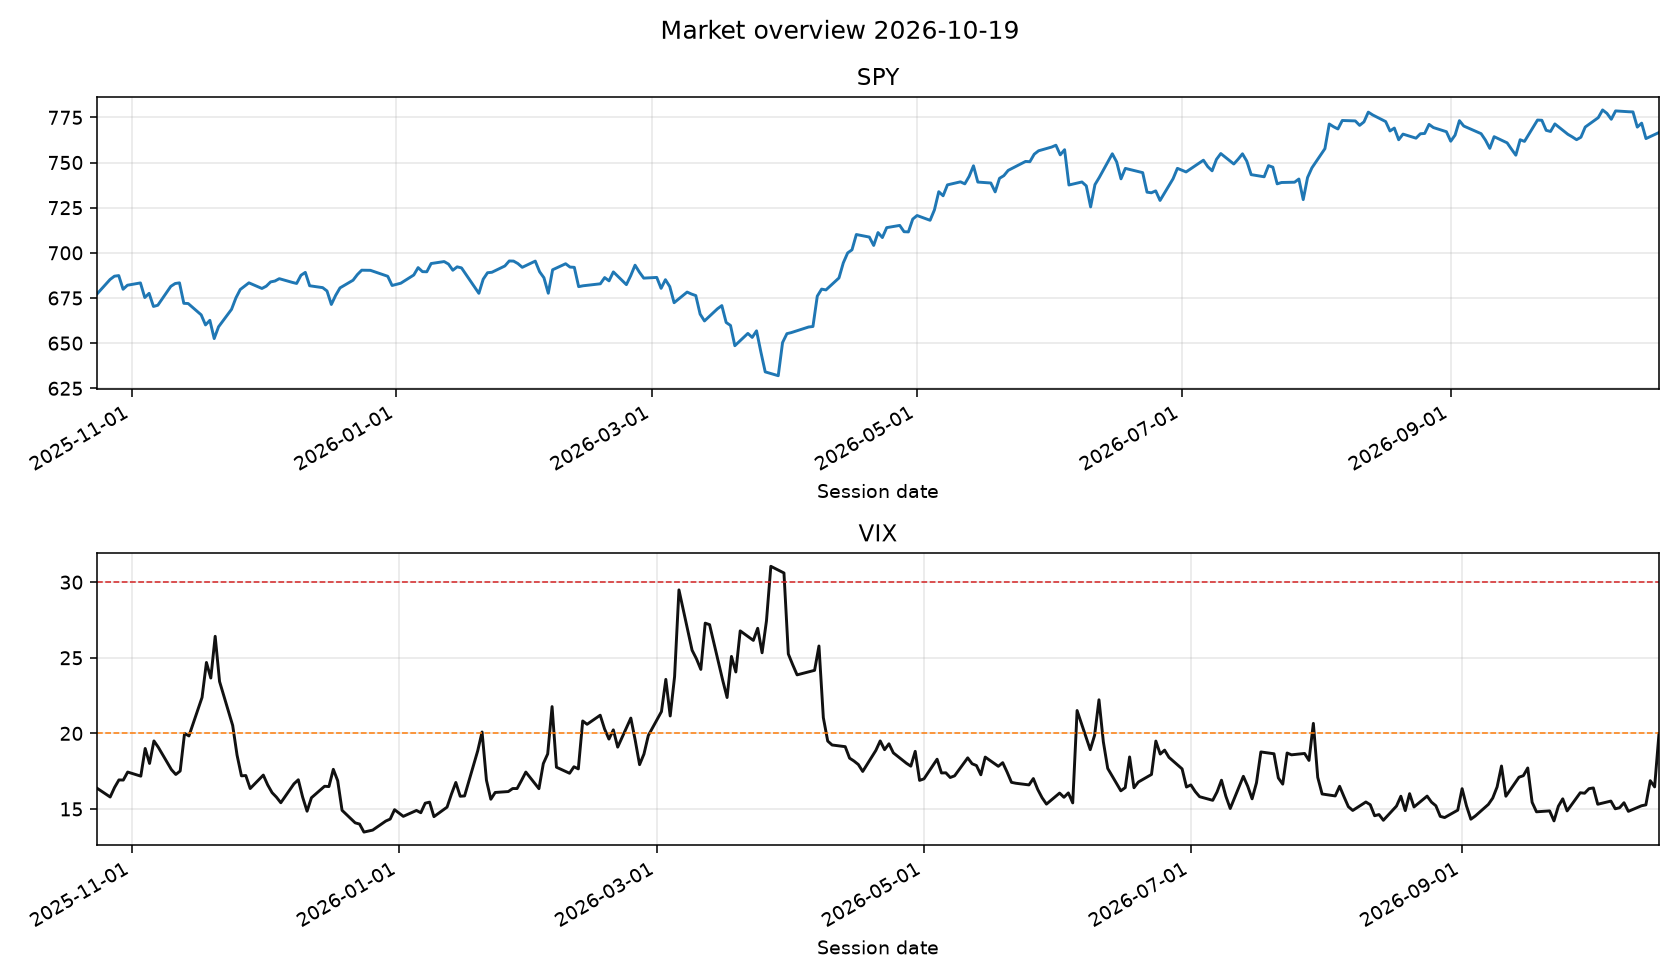
- VIX 19.99 low
- SPY 766.60
- 3 named setups
Research record of this close. Not a buy or sell instruction.
Desk take
Close print for 2026-10-19. VIX 19.99 (low) and SPY 766.6 set the tape. Hybrid desk: the scanner names the setup, the model grades that same print, and published conviction is the blend. The model cannot add a name that did not fire.
Amazon.com, Inc. (AMZN)
Scanner what happened: AMZN traded cheaper than its industry peers on trailing P/E at 86/100 (setup 100).
Why it printed:
- Trailing P/E 21.1 is below the internet retail / big-box peer median 28.6 (26% cheaper).
- Market cap still sits above the peer median ($2.83T vs $350.4B).
- Cap is more than 2× the peer median — quality/size filter.
- VIX regime is low (19.99).
- 21d relative strength vs SPY is 2.8%.
- Relative volume 1.42x.
Invalidation: Multiple re-rates up to the peer median P/E, or a daily close back below SMA200; stop ~249.44.
Continuation of the 2026-10-16 alert, not a new one — this is print 4 of one run: the same call has gone out 3 times since 2026-10-14 across 5 calendar days, most recently on 2026-10-16. Today is not a fresh signal; the setup was already true when the desk last printed it. The analog below measures the first session of a run, so its hit rate belongs to 2026-10-14, not to today.
Same-setup analogs on 21 names (n=265, n_eff=85.0, 95% CI 47–68%): 58% 21-session net hit rate against a 59% base rate, average +3.0%, vs SPY +1.2%.
The 95% interval includes 50%, so this is the desk's narrative setup rather than a demonstrated edge.
LLM confirm at 86/100: Amazon sits at a reasonable trailing P/E relative to peer medians while maintaining superior market capitalization and size. The low VIX regime provides a stable backdrop for this cheap_vs_industry setup, supported by positive 21-day relative strength and strong volume. The setup is clean and well-supported by quantitative filters.
Risk: A multiple re-rate up to peer medians or a breakdown below the 200-day moving average invalidates the thesis.
Taiwan Semiconductor (TSM)
Scanner what happened: TSM traded cheaper than its industry peers on trailing P/E at 81/100 (setup 98).
Why it printed:
- Trailing P/E 27.0 is below the semiconductors peer median 48.6 (44% cheaper).
- Market cap still sits above the peer median ($2.18T vs $878.4B).
- Cap is more than 2× the peer median — quality/size filter.
- VIX regime is low (19.99).
- Relative volume 1.05x.
Invalidation: Multiple re-rates up to the peer median P/E, or a daily close back below SMA200; stop ~395.43.
Continuation of the 2026-10-16 alert, not a new one — this is print 9 of one run: the same call has gone out 8 times since 2026-10-07 across 12 calendar days, most recently on 2026-10-16. Today is not a fresh signal; the setup was already true when the desk last printed it. The analog below measures the first session of a run, so its hit rate belongs to 2026-10-07, not to today.
Same-setup analogs on 21 names (n=265, n_eff=85.0, 95% CI 47–68%): 58% 21-session net hit rate against a 59% base rate, average +3.0%, vs SPY +1.2%.
The 95% interval includes 50%, so this is the desk's narrative setup rather than a demonstrated edge.
LLM confirm at 81/100: Taiwan Semiconductor exhibits a significant valuation discount relative to its semiconductor peers under a low volatility regime. Although recent relative strength is slightly negative, the fundamental quality and size thresholds are easily cleared. This cheap_vs_industry print looks sound for longer-term positioning.
Risk: Failing to hold major structural moving averages or a sudden contraction in industry multiples poses downside risk.
NVIDIA Corporation (NVDA)
Scanner what happened: NVDA traded cheaper than its industry peers on trailing P/E at 80/100 (setup 96).
Why it printed:
- Trailing P/E 31.0 is below the semiconductors peer median 37.9 (18% cheaper).
- Market cap still sits above the peer median ($5.24T vs $878.4B).
- Cap is more than 2× the peer median — quality/size filter.
- VIX regime is low (19.99).
- Relative volume 0.87x.
Invalidation: Multiple re-rates up to the peer median P/E, or a daily close back below SMA200; stop ~205.22.
Continuation of the 2026-10-16 alert, not a new one — this is print 12 of one run: the same call has gone out 11 times since 2026-10-02 across 17 calendar days, most recently on 2026-10-16. Today is not a fresh signal; the setup was already true when the desk last printed it. The analog below measures the first session of a run, so its hit rate belongs to 2026-10-02, not to today.
Same-setup analogs on 21 names (n=265, n_eff=85.0, 95% CI 47–68%): 58% 21-session net hit rate against a 59% base rate, average +3.0%, vs SPY +1.2%.
The 95% interval includes 50%, so this is the desk's narrative setup rather than a demonstrated edge.
LLM confirm at 80/100: NVIDIA qualifies for the cheap_vs_industry setup due to a trailing P/E discount against semiconductor peers despite holding massive market cap dominance. The low VIX environment supports accumulation despite mild near-term relative weakness. The setup offers a compelling large-cap value entry.
Risk: Loss of the 200-day moving average support would completely invalidate the structural bullish thesis.
Texas Instruments (TXN)
Scanner what happened: TXN pulled back to its 20-day average inside an uptrend at 74/100 (setup 90).
Why it printed:
- Price above SMA50 and SMA50 above SMA200 (bullish regime).
- VIX regime is low (19.99).
- RSI_14=47.2 is a reset, not a chase.
- Close is -2.1% from SMA20 (pullback/tag).
- 21d relative strength vs SPY is 2.9%.
- Relative volume 1.26x.
Invalidation: Stop ~258.74 (2x ATR) or daily close back below SMA50.
Continuation of the 2026-10-14 alert, not a new one — this is print 2 of one run: the same call went out on 2026-10-14. Today is not a fresh signal; the setup was already true when the desk last printed it. The analog below measures the first session of a run, so its hit rate belongs to 2026-10-14, not to today.
Same-setup analogs on 21 names (n=1020, n_eff=113.9, 95% CI 51–68%): 60% 21-session net hit rate against a 59% base rate, average +2.8%, vs SPY +1.5%.
The 95% interval includes 50%, so this is the desk's narrative setup rather than a demonstrated edge.
LLM confirm at 74/100: Texas Instruments presents a classic pullback_in_uptrend within a solid bullish moving average regime. An RSI reading near 47 indicates a healthy reset rather than an aggressive chase. Decent relative strength and supportive volume confirm the validity of this tag near the 20-day moving average.
Risk: A daily close dropping below the 50-day moving average breaks the structural uptrend.
Analog Devices (ADI)
Scanner what happened: ADI pulled back to its 20-day average inside an uptrend at 74/100 (setup 90).
Why it printed:
- Price above SMA50 and SMA50 above SMA200 (bullish regime).
- VIX regime is low (19.99).
- RSI_14=48.9 is a reset, not a chase.
- Close is -2.0% from SMA20 (pullback/tag).
- 21d relative strength vs SPY is 4.3%.
- Relative volume 1.14x.
Invalidation: Stop ~369.74 (2x ATR) or daily close back below SMA50.
Same-setup analogs on 21 names (n=1020, n_eff=113.9, 95% CI 51–68%): 60% 21-session net hit rate against a 59% base rate, average +2.8%, vs SPY +1.5%.
The 95% interval includes 50%, so this is the desk's narrative setup rather than a demonstrated edge.
LLM confirm at 74/100: Analog Devices shows constructive characteristics with price holding above key moving averages in a low VIX regime. The 2-percent pullback from the 20-day moving average accompanied by positive 21-day relative strength validates the pullback_in_uptrend setup. RSI near 49 represents an ideal mid-range reset.
Risk: Violating the 50-day moving average or a sharp increase in market volatility invalidates the setup.
Micron Technology (MU)
Scanner what happened: MU traded cheaper than its industry peers on trailing P/E at 75/100 (setup 90).
Why it printed:
- Trailing P/E 12.0 is below the semiconductors peer median 63.2 (81% cheaper).
- Market cap still sits above the peer median ($1.02T vs $682.4B).
- VIX regime is low (19.99).
- Relative volume 0.94x.
Invalidation: Multiple re-rates up to the peer median P/E, or a daily close back below SMA200; stop ~806.69.
Continuation of the 2026-10-15 alert, not a new one — this is print 11 of one run: the same call has gone out 10 times since 2026-10-02 across 17 calendar days, most recently on 2026-10-15. Today is not a fresh signal; the setup was already true when the desk last printed it. The analog below measures the first session of a run, so its hit rate belongs to 2026-10-02, not to today.
Same-setup analogs on 21 names (n=265, n_eff=85.0, 95% CI 47–68%): 58% 21-session net hit rate against a 59% base rate, average +3.0%, vs SPY +1.2%.
The 95% interval includes 50%, so this is the desk's narrative setup rather than a demonstrated edge.
LLM haircut at 65/100: Micron offers a deep trailing P/E discount compared to semiconductor peers, qualifying for the cheap_vs_industry setup. However, significant negative 21-day relative strength highlights persistent underlying weakness that lowers our enthusiasm. While the valuation metric is accurate, execution requires patience given the weak momentum.
Risk: Extended relative underperformance against the broader market could pressure the stock further before any multiple expansion occurs.
KLA (KLAC)
Scanner what happened: KLAC sat in a deep drawdown during VIX stress at 74/100 (setup 88).
Why it printed:
- Close is -45.9% from the 52-week high — a deep drawdown.
- Drawdown reaches 35% from the high.
- Drawdown is at least the mean of this name's largest completed pullbacks (37.9%).
- RSI_14=31.8 is washed out.
- Trailing P/E is 5% cheaper than the industry-peer median.
- TTM EPS is still growing through the drawdown (12.9% YoY).
Invalidation: Stop ~150.23 (2x ATR) or TTM earnings turning negative.
Continuation of the 2026-10-13 alert, not a new one — this is print 2 of one run: the same call went out on 2026-10-13. Today is not a fresh signal; the setup was already true when the desk last printed it. The analog below measures the first session of a run, so its hit rate belongs to 2026-10-13, not to today.
Same-setup analogs on 21 names (n=221, n_eff=58.2, 95% CI 50–74%): 63% 21-session net hit rate against a 59% base rate, average +3.6%, vs SPY +1.4%.
The 95% interval includes 50%, so this is the desk's narrative setup rather than a demonstrated edge.
LLM confirm at 74/100: KLA meets deep_drawdown_value criteria with a severe pullback exceeding historical mean drawdowns while continuing to grow earnings year-over-year. An RSI of 31.8 confirms a washed-out reading suitable for a washout buy context. The combination of deep discounting and ongoing earnings growth supports the grade.
Risk: A reversal in trailing earnings growth or failure to hold the defined stop level invalidates the setup.
Meta Platforms, Inc. (META)
Scanner what happened: META pulled back to its 20-day average inside an uptrend at 71/100 (setup 85).
Why it printed:
- Price above SMA50 and SMA50 above SMA200 (bullish regime).
- VIX regime is low (19.99).
- RSI_14=49.2 is a reset, not a chase.
- Close is -3.9% from SMA20 (pullback/tag).
- 21d relative strength vs SPY is 5.3%.
Invalidation: Stop ~656.26 (2x ATR) or daily close back below SMA50.
Continuation of the 2026-10-08 alert, not a new one — this is print 2 of one run: the same call went out on 2026-10-08. Today is not a fresh signal; the setup was already true when the desk last printed it. The analog below measures the first session of a run, so its hit rate belongs to 2026-10-08, not to today.
Same-setup analogs on 21 names (n=1020, n_eff=113.9, 95% CI 51–68%): 60% 21-session net hit rate against a 59% base rate, average +2.8%, vs SPY +1.5%.
The 95% interval includes 50%, so this is the desk's narrative setup rather than a demonstrated edge.
LLM confirm at 71/100: Meta Platforms displays a textbook pullback_in_uptrend backed by robust relative strength outperformance against the S&P 500. The RSI reset near 49 and a gentle tag of the 20-day moving average provide a low-risk entry point within a strong bullish regime. Overall technical structure remains very healthy.
Risk: A close beneath the rising 50-day moving average would invalidate the intermediate uptrend.
Alphabet Inc. (GOOGL)
Scanner what happened: GOOGL traded cheaper than its industry peers on trailing P/E at 69/100 (setup 75).
Why it printed:
- Trailing P/E 17.3 is below the interactive media peer median 17.6 (2% cheaper).
- Market cap still sits above the peer median ($2.02T vs $9.9B).
- Cap is more than 2× the peer median — quality/size filter.
- VIX regime is low (19.99).
Invalidation: Multiple re-rates up to the peer median P/E, or a daily close back below SMA200; stop ~326.79.
Same-setup analogs on 21 names (n=265, n_eff=85.0, 95% CI 47–68%): 58% 21-session net hit rate against a 59% base rate, average +3.0%, vs SPY +1.2%.
The 95% interval includes 50%, so this is the desk's narrative setup rather than a demonstrated edge.
LLM wait at 55/100: Alphabet qualifies technically for the cheap_vs_industry setup, but the valuation discount to peers is extremely narrow at just two percent. Given the flat-to-negative relative strength, this setup lacks compelling edge. We would not alter our schedule based on this marginal valuation print.
Risk: Subpar relative performance could lead to extended consolidation without meaningful upside.
Applied Materials (AMAT)
Scanner what happened: AMAT sat in a deep drawdown during VIX stress at 58/100 (setup 68).
Why it printed:
- Close is -44.1% from the 52-week high — a deep drawdown.
- Drawdown reaches 35% from the high.
- RSI_14=30.8 is washed out.
- Trailing P/E is 19% cheaper than the industry-peer median.
- TTM EPS is still growing through the drawdown (14.0% YoY).
Invalidation: Stop ~371.63 (2x ATR) or TTM earnings turning negative.
Same-setup analogs on 21 names (n=221, n_eff=58.2, 95% CI 50–74%): 63% 21-session net hit rate against a 59% base rate, average +3.6%, vs SPY +1.4%.
The 95% interval includes 50%, so this is the desk's narrative setup rather than a demonstrated edge.
LLM haircut at 52/100: Applied Materials triggers the deep_drawdown_value setup with a steep decline and washed-out RSI, accompanied by positive earnings growth. Nonetheless, weak 21-day relative strength and sluggish volume temper our conviction in an immediate turnaround. It functions more as a slow accumulation candidate than an urgent buy.
Risk: Persistent relative weakness could result in a prolonged base-building phase or lower lows.
Apple Inc. (AAPL)
Scanner what happened: AAPL closed near a 52-week high at 56/100 (setup 65).
Why it printed:
- Within 1.5% of 52-week high.
- Still in a bullish SMA regime.
- Beating SPY by 1.4% over 21d.
- VIX regime low.
Invalidation: Failed breakout if close back below prior 52w high and stop ~329.66.
Same-setup analogs on 21 names (n=739, n_eff=100.7, 95% CI 49–68%): 59% 21-session net hit rate against a 59% base rate, average +2.8%, vs SPY +1.8%.
The 95% interval includes 50%, so this is the desk's narrative setup rather than a demonstrated edge.
LLM wait at 50/100: Apple prints as a breakout setup near its 52-week high within a favorable moving average regime. However, relative volume is subdued and the upside buffer is narrow, making it a lower-conviction chase. We prefer to wait for higher relative volume or a cleaner consolidation pattern.
Risk: A failed breakout occurring on a daily close back below the prior high negates the setup.
Microsoft Corporation (MSFT)
Scanner what happened: MSFT pulled back to its 20-day average inside an uptrend at 48/100 (setup 55).
Why it printed:
- Price above SMA50 and SMA50 above SMA200 (bullish regime).
- VIX regime is low (19.99).
- 21d relative strength vs SPY is 7.4%.
Invalidation: Stop ~510.21 (2x ATR) or daily close back below SMA50.
Same-setup analogs on 21 names (n=1020, n_eff=113.9, 95% CI 51–68%): 60% 21-session net hit rate against a 59% base rate, average +2.8%, vs SPY +1.5%.
The 95% interval includes 50%, so this is the desk's narrative setup rather than a demonstrated edge.
LLM wait at 45/100: Microsoft shows solid intermediate trend metrics and strong relative strength, but the print lacks a clear near-term pullback or specialized setup trigger beyond general bullish continuation. The low relative volume suggests a lack of immediate institutional urgency. We would pass on changing schedules for this print.
Risk: A breakdown under the 50-day moving average would abruptly terminate the prevailing uptrend.
Overall: mixed hybrid tape. Read each card's scanner grade, LLM stance, and hybrid conviction separately — not as one market call.
RESEARCH ONLY — not advice.
Named setups
AMZN AMZN traded cheaper than its industry peers on trailing P/E
Close262.45
Stop249.44
Hybrid 86/100 · buy · named setup cheap vs industry
Scanner 86/100 LLM confirm 86/100
Amazon sits at a reasonable trailing P/E relative to peer medians while maintaining superior market capitalization and size. The low VIX regime provides a stable backdrop for this cheap_vs_industry setup, supported by positive 21-day relative strength and strong volume. The setup is clean and well-supported by quantitative filters.
Multiple re-rates up to the peer median P/E, or a daily close back below SMA200.
TSM TSM traded cheaper than its industry peers on trailing P/E
Close420.29
Stop395.43
Hybrid 81/100 · buy · named setup cheap vs industry
Scanner 81/100 LLM confirm 81/100
Taiwan Semiconductor exhibits a significant valuation discount relative to its semiconductor peers under a low volatility regime. Although recent relative strength is slightly negative, the fundamental quality and size thresholds are easily cleared. This cheap_vs_industry print looks sound for longer-term positioning.
Multiple re-rates up to the peer median P/E, or a daily close back below SMA200.
NVDA NVDA traded cheaper than its industry peers on trailing P/E
Close217.09
Stop205.22
Hybrid 80/100 · buy · named setup cheap vs industry
Scanner 80/100 LLM confirm 80/100
NVIDIA qualifies for the cheap_vs_industry setup due to a trailing P/E discount against semiconductor peers despite holding massive market cap dominance. The low VIX environment supports accumulation despite mild near-term relative weakness. The setup offers a compelling large-cap value entry.
Multiple re-rates up to the peer median P/E, or a daily close back below SMA200.
Window Over the measured window — ten years of the local tape, 21 names, onsets spaced so one market phase counts once, and a 10 bps round trip — no named setup beat holding these companies. Result The unconditional 21-session up-rate was 58.67%. On buy-now versus wait through the next 21 sessions, every setup landed between −0.67% and +0.64% against a random session. One setup clears the publish gate: historic_drawdown at a 61.25% net hit rate on 352 onsets, and its 95% interval bottoms out at 50.33% — a third of a point above a coin. How to read Read that as a gate it passed, not an edge it demonstrated. The desk publishes named setups as context — what happened on the tape — not as timing calls. Scheduled accumulation is the default the evidence supports. The 58.67% figure is not an expected future return: the universe is today's survivors chosen after the fact, which inflates the absolute up-rate.
On the shelf
The public page keeps the latest close and the four before it.