
Close print
2026-10-20
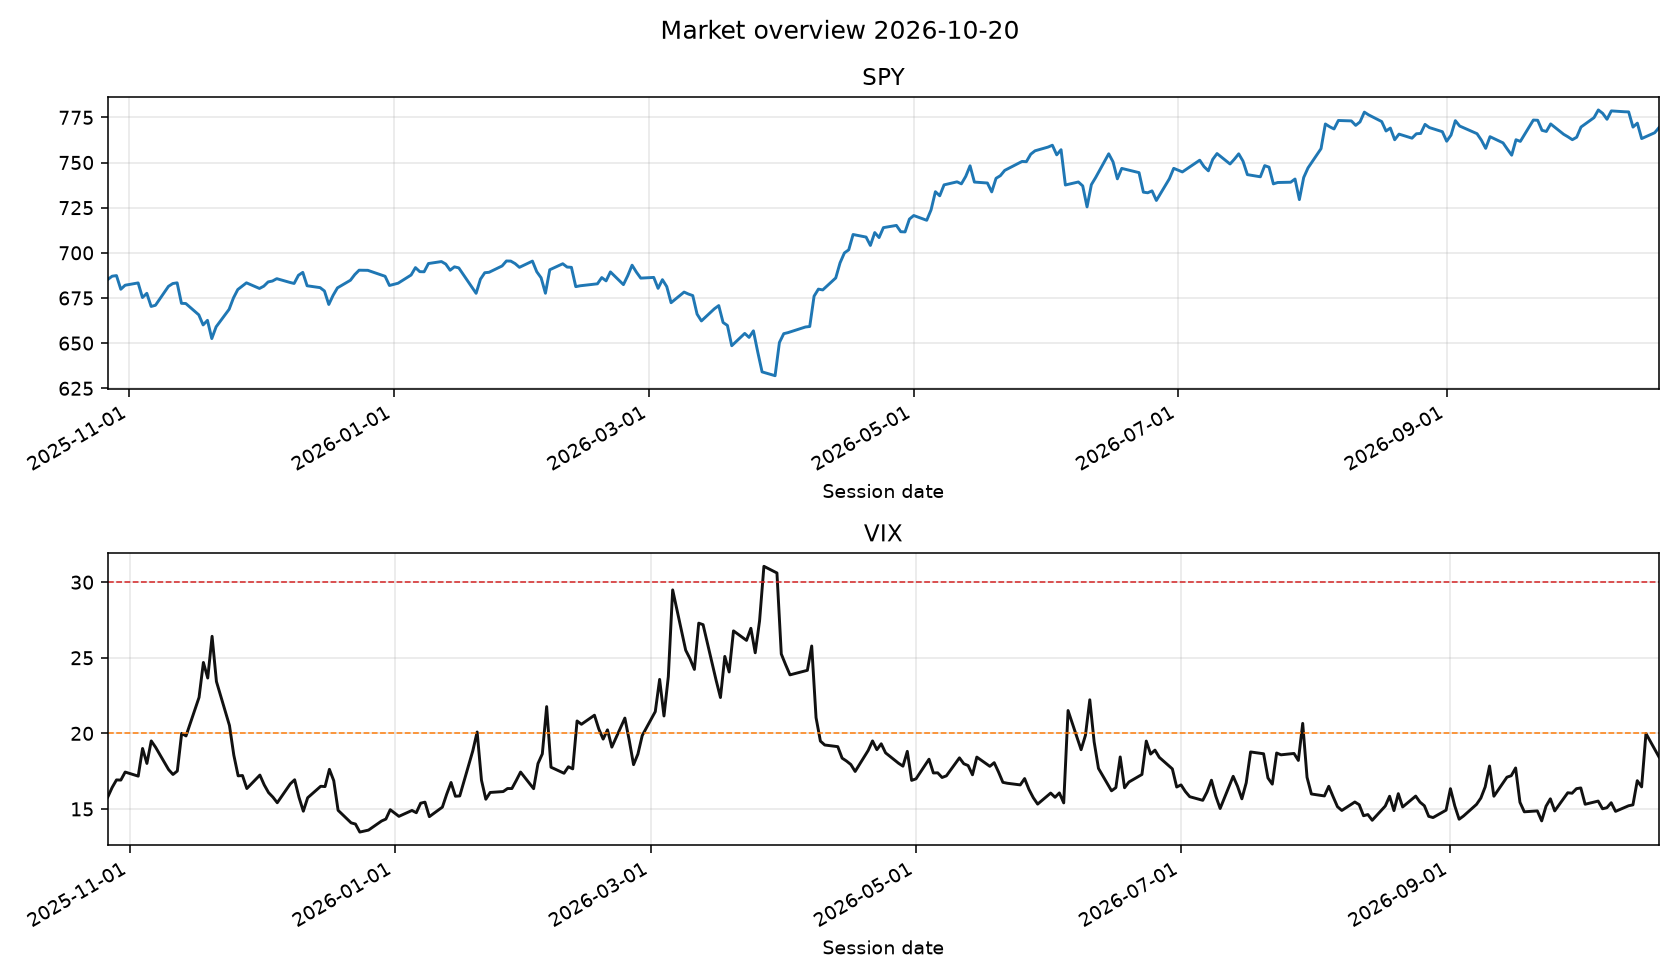
- VIX 18.44 low
- SPY 769.32
- 1 named setups
- Free teaser
Over the measured window — ten years of the local tape, 21 names, onsets spaced so one market phase counts once, and a 10 bps round trip — no named setup beat holding these companies. The unconditional 21-session up-rate was 58.67%. On buy-now versus wait through the next 21 sessions, every setup landed between −0.67% and +0.64% against a random session. One setup clears the publish gate: historic_drawdown at a 61.25% net hit rate on 352 onsets, and its 95% interval bottoms out at 50.33% — a third of a point above a coin. Read that as a gate it passed, not an edge it demonstrated. The desk publishes named setups as context — what happened on the tape — not as timing calls. Scheduled accumulation is the default the evidence supports. The 58.67% figure is not an expected future return: the universe is today's survivors chosen after the fact, which inflates the absolute up-rate.
Desk take
What we think of this print
Close print for 2026-10-20. VIX 18.44 (low) and SPY 769.32 set the tape. Hybrid desk: the scanner names the setup, the model grades that same print, and published conviction is the blend. The model cannot add a name that did not fire.
Amazon.com, Inc. (AMZN)
Scanner what happened: AMZN traded cheaper than its industry peers on trailing P/E at 87/100 (setup 100).
Why it printed:
- Trailing P/E 21.1 is below the internet retail / big-box peer median 28.6 (26% cheaper).
- Market cap still sits above the peer median ($2.83T vs $350.4B).
- Cap is more than 2× the peer median — quality/size filter.
- VIX regime is low (18.44).
- 21d relative strength vs SPY is 2.2%.
- Relative volume 0.87x.
Invalidation: Multiple re-rates up to the peer median P/E, or a daily close back below SMA200; stop ~249.85.
Continuation of the 2026-10-19 alert, not a new one — this is print 5 of one run: the same call has gone out 4 times since 2026-10-14 across 6 calendar days, most recently on 2026-10-19. Today is not a fresh signal; the setup was already true when the desk last printed it. The analog below measures the first session of a run, so its hit rate belongs to 2026-10-14, not to today.
Same-setup analogs on 21 names (n=265, n_eff=86.2, 95% CI 47–68%): 58% 21-session net hit rate against a 59% base rate, average +3.0%, vs SPY +1.2%.
The 95% interval includes 50%, so this is the desk's narrative setup rather than a demonstrated edge.
LLM confirm at 87/100: The setup captures a clear valuation discount relative to retail peers with supportive relative strength. A low VIX regime provides a stable backdrop for this mega-cap deployment. The repeated prints reinforce institutional accumulation over the scanning window.
Risk: A sudden multiple contraction or loss of the 200-day moving average would violate the structural thesis.
Taiwan Semiconductor (TSM)
Scanner what happened: TSM traded cheaper than its industry peers on trailing P/E at 79/100 (setup 98).
Why it printed:
- Trailing P/E 27.4 is below the semiconductors peer median 48.1 (43% cheaper).
- Market cap still sits above the peer median ($2.21T vs $872.9B).
- Cap is more than 2× the peer median — quality/size filter.
- VIX regime is low (18.44).
- Relative volume 1.05x.
Invalidation: Multiple re-rates up to the peer median P/E, or a daily close back below SMA200; stop ~400.48.
Continuation of the 2026-10-19 alert, not a new one — this is print 10 of one run: the same call has gone out 9 times since 2026-10-07 across 13 calendar days, most recently on 2026-10-19. Today is not a fresh signal; the setup was already true when the desk last printed it. The analog below measures the first session of a run, so its hit rate belongs to 2026-10-07, not to today.
Same-setup analogs on 21 names (n=265, n_eff=86.2, 95% CI 47–68%): 58% 21-session net hit rate against a 59% base rate, average +3.0%, vs SPY +1.2%.
The 95% interval includes 50%, so this is the desk's narrative setup rather than a demonstrated edge.
LLM confirm at 79/100: Trading at a substantial discount to the broader semiconductor peer median while maintaining dominant scale makes this a compelling value observation. RSI and volume parameters indicate a calm consolidation phase rather than panicked liquidation. Sustained recurrence confirms ongoing scanner interest.
Risk: Geopolitical headlines or failure to hold the specified stop level invalidates the setup.
NVIDIA Corporation (NVDA)
Scanner what happened: NVDA traded cheaper than its industry peers on trailing P/E at 74/100 (setup 91).
Why it printed:
- Trailing P/E 30.9 is below the semiconductors peer median 37.9 (18% cheaper).
- Market cap still sits above the peer median ($5.23T vs $872.9B).
- Cap is more than 2× the peer median — quality/size filter.
- VIX regime is low (18.44).
Invalidation: Multiple re-rates up to the peer median P/E, or a daily close back below SMA200; stop ~204.64.
Continuation of the 2026-10-19 alert, not a new one — this is print 13 of one run: the same call has gone out 12 times since 2026-10-02 across 18 calendar days, most recently on 2026-10-19. Today is not a fresh signal; the setup was already true when the desk last printed it. The analog below measures the first session of a run, so its hit rate belongs to 2026-10-02, not to today.
Same-setup analogs on 21 names (n=265, n_eff=86.2, 95% CI 47–68%): 58% 21-session net hit rate against a 59% base rate, average +3.0%, vs SPY +1.2%.
The 95% interval includes 50%, so this is the desk's narrative setup rather than a demonstrated edge.
LLM haircut at 74/100: Although the valuation discount versus the peer group is valid, negative 21-day relative strength tempers the immediate upside appeal. Subdued relative volume suggests market participants are hesitant to drive aggressive accumulation here. It remains a constructive name, but the lack of momentum warrants a lower grade.
Risk: Continued underperformance against the broader market could drag the stock below key support.
Apple Inc. (AAPL)
Scanner what happened: AAPL pulled back to its 20-day average inside an uptrend at 73/100 (setup 90).
Why it printed:
- Price above SMA50 and SMA50 above SMA200 (bullish regime).
- VIX regime is low (18.44).
- RSI_14=55.5 is a reset, not a chase.
- Close is 0.6% from SMA20 (pullback/tag).
- 21d relative strength vs SPY is 0.7%.
- Relative volume 0.85x.
Invalidation: Stop ~326.55 (2x ATR) or daily close back below SMA50.
Continuation of the 2026-10-09 alert, not a new one — this is print 5 of one run: the same call has gone out 4 times since 2026-10-02 across 18 calendar days, most recently on 2026-10-09. Today is not a fresh signal; the setup was already true when the desk last printed it. The analog below measures the first session of a run, so its hit rate belongs to 2026-10-02, not to today.
Same-setup analogs on 21 names (n=1021, n_eff=113.9, 95% CI 51–68%): 60% 21-session net hit rate against a 59% base rate, average +2.8%, vs SPY +1.5%.
The 95% interval includes 50%, so this is the desk's narrative setup rather than a demonstrated edge.
LLM confirm at 73/100: The price action successfully respects a classic pullback to the 20-day moving average within a confirmed structural uptrend. RSI sits at a healthy midpoint reset rather than an extended chase level. Low volatility conditions favor this orderly continuation pattern.
Risk: A breakdown beneath the 50-day moving average or the calculated ATR stop invalidates the trend continuity.
Texas Instruments (TXN)
Scanner what happened: TXN pulled back to its 20-day average inside an uptrend at 73/100 (setup 90).
Why it printed:
- Price above SMA50 and SMA50 above SMA200 (bullish regime).
- VIX regime is low (18.44).
- RSI_14=49.0 is a reset, not a chase.
- Close is -1.7% from SMA20 (pullback/tag).
- 21d relative strength vs SPY is 3.1%.
- Relative volume 1.01x.
Invalidation: Stop ~260.12 (2x ATR) or daily close back below SMA50.
Continuation of the 2026-10-14 alert, not a new one — this is print 2 of one run: the same call went out on 2026-10-14. Today is not a fresh signal; the setup was already true when the desk last printed it. The analog below measures the first session of a run, so its hit rate belongs to 2026-10-14, not to today.
Same-setup analogs on 21 names (n=1021, n_eff=113.9, 95% CI 51–68%): 60% 21-session net hit rate against a 59% base rate, average +2.8%, vs SPY +1.5%.
The 95% interval includes 50%, so this is the desk's narrative setup rather than a demonstrated edge.
LLM confirm at 73/100: Positive relative strength paired with a clean tag of the short-term moving average validates the pullback framework. The RSI reading near 49 indicates a balanced consolidation before potential continuation. Volume is adequate to support the observed setup.
Risk: Market-wide semiconductor weakness could easily push prices through the trailing stop threshold.
KLA (KLAC)
Scanner what happened: KLAC sat in a deep drawdown during VIX stress at 72/100 (setup 88).
Why it printed:
- Close is -47.4% from the 52-week high — a deep drawdown.
- Drawdown reaches 35% from the high.
- Drawdown is at least the mean of this name's largest completed pullbacks (37.9%).
- RSI_14=29.3 is washed out.
- Trailing P/E is 5% cheaper than the industry-peer median.
- TTM EPS is still growing through the drawdown (12.9% YoY).
Invalidation: Stop ~145.80 (2x ATR) or TTM earnings turning negative.
Continuation of the 2026-10-13 alert, not a new one — this is print 2 of one run: the same call went out on 2026-10-13. Today is not a fresh signal; the setup was already true when the desk last printed it. The analog below measures the first session of a run, so its hit rate belongs to 2026-10-13, not to today.
Same-setup analogs on 21 names (n=221, n_eff=58.2, 95% CI 50–74%): 63% 21-session net hit rate against a 59% base rate, average +3.6%, vs SPY +1.4%.
The 95% interval includes 50%, so this is the desk's narrative setup rather than a demonstrated edge.
LLM confirm at 72/100: A severe drawdown exceeding historical mean pullbacks creates a classic washout opportunity supported by robust underlying earnings growth. The deeply oversold RSI reading combined with above-average relative volume points to capitulation behavior. This fits the washout buy criteria cleanly.
Risk: Deteriorating fundamental earnings or a breakdown past the ATR stop level negates the recovery thesis.
Analog Devices (ADI)
Scanner what happened: ADI pulled back to its 20-day average inside an uptrend at 69/100 (setup 85).
Why it printed:
- Price above SMA50 and SMA50 above SMA200 (bullish regime).
- VIX regime is low (18.44).
- RSI_14=50.9 is a reset, not a chase.
- Close is -1.4% from SMA20 (pullback/tag).
- 21d relative strength vs SPY is 4.2%.
Invalidation: Stop ~372.02 (2x ATR) or daily close back below SMA50.
Same-setup analogs on 21 names (n=1021, n_eff=113.9, 95% CI 51–68%): 60% 21-session net hit rate against a 59% base rate, average +2.8%, vs SPY +1.5%.
The 95% interval includes 50%, so this is the desk's narrative setup rather than a demonstrated edge.
LLM confirm at 69/100: Strong relative strength against the S&P 500 alongside an orderly pullback to the 20-day average supports the trend continuation setup. The low VIX environment allows for controlled price discovery without excessive noise. RSI is ideally neutral.
Risk: Failure to maintain the 50-day moving average breaks the structural uptrend rules.
Micron Technology (MU)
Scanner what happened: MU traded cheaper than its industry peers on trailing P/E at 69/100 (setup 85).
Why it printed:
- Trailing P/E 11.9 is below the semiconductors peer median 63.2 (81% cheaper).
- Market cap still sits above the peer median ($1.01T vs $678.8B).
- VIX regime is low (18.44).
Invalidation: Multiple re-rates up to the peer median P/E, or a daily close back below SMA200; stop ~799.54.
Continuation of the 2026-10-15 alert, not a new one — this is print 11 of one run: the same call has gone out 10 times since 2026-10-02 across 18 calendar days, most recently on 2026-10-15. Today is not a fresh signal; the setup was already true when the desk last printed it. The analog below measures the first session of a run, so its hit rate belongs to 2026-10-02, not to today.
Same-setup analogs on 21 names (n=265, n_eff=86.2, 95% CI 47–68%): 58% 21-session net hit rate against a 59% base rate, average +3.0%, vs SPY +1.2%.
The 95% interval includes 50%, so this is the desk's narrative setup rather than a demonstrated edge.
LLM haircut at 69/100: The massive P/E discount to the peer median highlights extreme relative cheapness, yet significant negative relative strength signals persistent overhead pressure. Low relative volume shows buyers are not yet stepping in aggressively. The setup is valid but carries noticeable momentum drag.
Risk: Deep relative weakness can persist longer than expected, challenging the drawdown tolerance.
Alphabet Inc. (GOOGL)
Scanner what happened: GOOGL traded cheaper than its industry peers on trailing P/E at 66/100 (setup 75).
Why it printed:
- Trailing P/E 17.1 is below the interactive media peer median 17.5 (2% cheaper).
- Market cap still sits above the peer median ($2.00T vs $9.9B).
- Cap is more than 2× the peer median — quality/size filter.
- VIX regime is low (18.44).
Invalidation: Multiple re-rates up to the peer median P/E, or a daily close back below SMA200; stop ~323.21.
Same-setup analogs on 21 names (n=265, n_eff=86.2, 95% CI 47–68%): 58% 21-session net hit rate against a 59% base rate, average +3.0%, vs SPY +1.2%.
The 95% interval includes 50%, so this is the desk's narrative setup rather than a demonstrated edge.
LLM haircut at 66/100: The valuation spread against interactive media peers is narrow, providing only a marginal discount argument. Negative 21-day relative performance detracts from the immediate attractiveness of the print. It meets criteria on paper, but lacks compelling secondary confirmation.
Risk: A slip under the primary long-term moving average invalidates the base case.
Qualcomm (QCOM)
Scanner what happened: QCOM pulled back to its 20-day average inside an uptrend at 58/100 (setup 70).
Why it printed:
- Price above SMA50 and SMA50 above SMA200 (bullish regime).
- VIX regime is low (18.44).
- RSI_14=47.1 is a reset, not a chase.
- Close is -3.2% from SMA20 (pullback/tag).
Invalidation: Stop ~161.60 (2x ATR) or daily close back below SMA50.
Continuation of the 2026-10-05 alert, not a new one — this is print 3 of one run: the same call has gone out twice since 2026-10-02 across 18 calendar days, most recently on 2026-10-05. Today is not a fresh signal; the setup was already true when the desk last printed it. The analog below measures the first session of a run, so its hit rate belongs to 2026-10-02, not to today.
Same-setup analogs on 21 names (n=1021, n_eff=113.9, 95% CI 51–68%): 60% 21-session net hit rate against a 59% base rate, average +2.8%, vs SPY +1.5%.
The 95% interval includes 50%, so this is the desk's narrative setup rather than a demonstrated edge.
LLM wait at 58/100: While the pullback parameters are technically met within a structural bull regime, negative relative strength and sluggish volume suggest little urgency. The print does not offer enough edge to alter an existing operational schedule. Patience is preferred over immediate execution.
Risk: Drifting further below short-term averages could accelerate the downtrend relative to the index.
Applied Materials (AMAT)
Scanner what happened: AMAT sat in a deep drawdown during VIX stress at 56/100 (setup 68).
Why it printed:
- Close is -44.1% from the 52-week high — a deep drawdown.
- Drawdown reaches 35% from the high.
- RSI_14=30.8 is washed out.
- Trailing P/E is 19% cheaper than the industry-peer median.
- TTM EPS is still growing through the drawdown (14.0% YoY).
Invalidation: Stop ~371.63 (2x ATR) or TTM earnings turning negative.
Same-setup analogs on 21 names (n=221, n_eff=58.2, 95% CI 50–74%): 63% 21-session net hit rate against a 59% base rate, average +3.6%, vs SPY +1.4%.
The 95% interval includes 50%, so this is the desk's narrative setup rather than a demonstrated edge.
LLM confirm at 56/100: The deep drawdown criteria are fully satisfied by the massive percentage drop from highs paired with a washed-out RSI. Continued year-over-year earnings expansion through the decline validates the fundamental backing of this washout buy. Volume metrics confirm active turnover.
Risk: Prolonged sector weakness could test crucial technical support levels below current prices.
Meta Platforms, Inc. (META)
Scanner what happened: META pulled back to its 20-day average inside an uptrend at 50/100 (setup 60).
Why it printed:
- Price above SMA50 and SMA50 above SMA200 (bullish regime).
- VIX regime is low (18.44).
- RSI_14=46.4 is a reset, not a chase.
- Relative volume 0.80x.
Invalidation: Stop ~645.10 (2x ATR) or daily close back below SMA50.
Continuation of the 2026-10-08 alert, not a new one — this is print 2 of one run: the same call went out on 2026-10-08. Today is not a fresh signal; the setup was already true when the desk last printed it. The analog below measures the first session of a run, so its hit rate belongs to 2026-10-08, not to today.
Same-setup analogs on 21 names (n=1021, n_eff=113.9, 95% CI 51–68%): 60% 21-session net hit rate against a 59% base rate, average +2.8%, vs SPY +1.5%.
The 95% interval includes 50%, so this is the desk's narrative setup rather than a demonstrated edge.
LLM wait at 50/100: The pullback setup is technically present, but sub-par relative volume and negative intermediate relative strength make this uncompelling. The score sits at the lower bound of acceptable thresholds for active deployment. There is no structural urgency to act on this print.
Risk: Breaching the 50-day moving average would cancel the bullish posture entirely.
Lam Research (LRCX)
Scanner what happened: LRCX sat in a deep drawdown during VIX stress at 50/100 (setup 60).
Why it printed:
- Close is -39.9% from the 52-week high — a deep drawdown.
- Drawdown reaches 35% from the high.
- RSI_14=32.5 is washed out.
- TTM EPS is still growing through the drawdown (40.6% YoY).
Invalidation: Stop ~234.80 (2x ATR) or TTM earnings turning negative.
Same-setup analogs on 21 names (n=221, n_eff=58.2, 95% CI 50–74%): 63% 21-session net hit rate against a 59% base rate, average +3.6%, vs SPY +1.4%.
The 95% interval includes 50%, so this is the desk's narrative setup rather than a demonstrated edge.
LLM confirm at 50/100: Substantial price contraction from 52-week highs matches the deep drawdown profile, bolstered by strong double-digit earnings growth. The oversold RSI indicates selling exhaustion is near completion. This qualifies as a logical washout buy under low volatility rules.
Risk: A failure of the calculated stop boundary or unexpected cyclical deterioration invalidates the bounce hypothesis.
Microsoft Corporation (MSFT)
Scanner what happened: MSFT pulled back to its 20-day average inside an uptrend at 46/100 (setup 55).
Why it printed:
- Price above SMA50 and SMA50 above SMA200 (bullish regime).
- VIX regime is low (18.44).
- 21d relative strength vs SPY is 6.6%.
Invalidation: Stop ~508.97 (2x ATR) or daily close back below SMA50.
Same-setup analogs on 21 names (n=1021, n_eff=113.9, 95% CI 51–68%): 60% 21-session net hit rate against a 59% base rate, average +2.8%, vs SPY +1.5%.
The 95% interval includes 50%, so this is the desk's narrative setup rather than a demonstrated edge.
LLM wait at 46/100: Although relative strength is high, the low relative volume and elevated RSI indicate the move lacks ideal pullback characteristics. The setup fires weakly based on score constraints, offering limited margin for error. It is best left on the watch list rather than acted upon.
Risk: An overbought reversal could quickly trigger the structural stop-loss parameters.
Overall: mixed hybrid tape. Read each card's scanner grade, LLM stance, and hybrid conviction separately — not as one market call.
RESEARCH ONLY — not advice.
Scanner names what happened on the tape. The model grades that observation. Hybrid conviction is what publishes. The model cannot add a name that did not fire. Research only — not a timing call.
add reminders
Five add reminders
Live add reminders: K1, K2, K3, K4, and K5. Exclusive listing, strongest first. K6, K7, K8, K9, and K10 repeat those shapes on the name's industry tape and can print on the same close. K11 and K12 are that name's own RSI and can print on the same close. Not a named setup. Does not score. Now vs 52w is close versus the 252-session high. This-name median is that same drawdown on this ticker's prior fires of the same gate.
Target is this close times that row's frozen average move. Strike is 5% under the target. 21 / 30 / 60 / 90 / 180 are trading sessions. Not a listed contract and not a premium.
K5 Daily RSI (calm)
KLAC 161.74
- RSI
- 29.3
- VIX
- 18.44
- Now vs 52w
- -47.4%
- This name median
- -18.9% n=5
- Prior fires
- 5 on this name
- ATM put proxy
- +2.1%
Target / strike
- 21d +4.6% → 169.22 · strike 160.76
- 30d +5.8% → 171.06 · strike 162.51
- 60d +9.2% → 176.57 · strike 167.74
- 90d +12.0% → 181.23 · strike 172.16
- 180d +30.8% → 211.53 · strike 200.96
this name n=5 · 7d +1.4% (80% ITM) · 14d +3.9% (80% ITM) · 21d +4.4% (100% ITM) · 28d +8.4% (100% ITM)
- 2017-08-04 · 7d +2.5% · 14d +1.7% · 21d +5.4% · 28d +9.7%
- 2018-06-27 · 7d +5.3% · 14d +9.5% · 21d +6.9% · 28d +17.4%
- 2018-10-19 · 7d +0.9% · 14d +6.9% · 21d +1.7% · 28d +6.5%
- 2019-05-14 · 7d -4.6% · 14d -3.9% · 21d +1.3% · 28d +3.3%
- 2024-11-15 · 7d +2.8% · 14d +5.5% · 21d +6.6% · 28d +4.9%
K9 Daily RSI (industry elevated)
KLAC 161.74 SMH 26.4
- RSI
- 29.3
- VIX
- 18.44
- Now vs 52w
- -47.4%
- This name median
- —
- Prior fires
- —
- ATM put proxy
- +2.1%
K12 Daily RSI
KLAC 161.74
- RSI
- 29.3
- VIX
- 18.44
- Now vs 52w
- -47.4%
- This name median
- -24.3% n=9
- Prior fires
- 9 on this name
- ATM put proxy
- +2.1%
Target / strike
- 21d +4.6% → 169.21 · strike 160.75
- 30d +5.8% → 171.18 · strike 162.62
- 60d +12.0% → 181.13 · strike 172.08
- 90d +17.6% → 190.22 · strike 180.71
- 180d +34.3% → 217.15 · strike 206.29
this name n=9 · 7d +5.5% (78% ITM) · 14d +5.0% (67% ITM) · 21d +10.2% (100% ITM) · 28d +14.4% (89% ITM)
- 2017-08-04 · 7d +2.5% · 14d +1.7% · 21d +5.4% · 28d +9.7%
- 2018-06-27 · 7d +5.3% · 14d +9.5% · 21d +6.9% · 28d +17.4%
- 2018-10-10 · 7d -3.2% · 14d -2.4% · 21d +3.4% · 28d -1.6%
- 2018-12-24 · 7d +12.4% · 14d +13.9% · 21d +24.8% · 28d +31.5%
- 2019-05-13 · 7d -2.7% · 14d -6.5% · 21d +1.2% · 28d +4.7%
- 2020-09-11 · 7d +6.6% · 14d +15.7% · 21d +24.8% · 28d +20.0%
- 2022-09-26 · 7d +8.4% · 14d -13.1% · 21d +0.4% · 28d +3.6%
- 2024-11-15 · 7d +2.8% · 14d +5.5% · 21d +6.6% · 28d +4.9%
- 2025-04-04 · 7d +17.3% · 14d +20.5% · 21d +17.8% · 28d +39.8%
Quiet today: K1 Weekly RSI (fear) · K2 Weekly RSI (elevated) · K3 Daily RSI (fear) · K4 Daily RSI (elevated) · K6 Weekly RSI (industry stress) · K7 Weekly RSI (industry elevated) · K8 Daily RSI (industry stress) · K10 Daily RSI (industry calm) · K11 Weekly RSI.
Quiet watch: no desk name is approaching. VIX must already be 30.
AMZN AMZN traded cheaper than its industry peers on trailing P/E
Hybrid 87/100 · buy · named setup cheap vs industry
Scanner 87/100 LLM confirm 87/100
The setup captures a clear valuation discount relative to retail peers with supportive relative strength. A low VIX regime provides a stable backdrop for this mega-cap deployment. The repeated prints reinforce institutional accumulation over the scanning window.
Multiple re-rates up to the peer median P/E, or a daily close back below SMA200; stop ~249.85.
- Close
- 262.63
- vs SMA20
- +3.5%
- RSI 14
- 57.4
- Stop
- 249.85
Pattern readings
| Pattern | Current | Threshold | vs | Status |
|---|---|---|---|---|
| Historic drawdown | 7.5% | >= top-3 avg 40.4% | 0.19x | below |
| 20d range high | 262.63 | > 263.72 | -0.4% | below |
| 20d range low | 262.63 | < 244.73 | +7.3% | below |
| Relative volume | 0.87x | >= 1.50x expansion / <= 0.70x dry-up | 0.58x vs expansion | below |
| RSI_14 | 57.4 | oversold < 30 · reset 35-58 · overbought > 70 | mid 30-70 | inside |
| MACD vs signal | 1.295 vs 0.424 | cross up: line > signal after line <= signal | spread 0.871 | above |
| Bollinger squeeze | width 8.430 | <= 20%ile cutoff 7.218 | 1.17x cutoff | below |
| vs SMA20 (pullback tag) | +3.5% | -4.0% to +1.2% | +3.5% | outside |
| vs 52w high (breakout) | -8.6% | >= -3.0% (within 3% of high) | -8.6% | below |
| SMA50 vs SMA200 | 256.53 vs 243.07 | golden: 50 > 200 · death: 50 < 200 | +5.5% | above |
| VIX | 18.44 (low) | elevated >= 20 · stress >= 30 | 18.44 | low |
Similar-setup analog
cheap vs industry onset · 265 samples · last 2300 sessions (publish window). What happened on similar days — not a forecast.
| Horizon | n | Hit rate | Base rate | Avg | vs SPY | Beat SPY |
|---|---|---|---|---|---|---|
| 5d | 265 | 57% | 54% | +0.9% | +0.5% | 56% |
| 10d | 264 | 59% | 56% | +1.9% | +0.8% | 52% |
| 21d | 263 | 58% | 59% | +3.0% | +1.2% | 52% |
| 63d | 259 | 64% | 63% | +9.7% | +5.6% | 58% |
| 126d | 250 | 68% | 68% | +17.7% | +10.4% | 59% |
Hit rate is shown next to the 21-session base rate so the comparison is unavoidable. The ~60% absolute up-rate is not an expected future return: the universe is today's winners chosen after the fact. Beat SPY is how often one trade finished ahead of the index; the SPY columns carry no trading cost because buying the index pays the same round trip.
Print board
Discussion
0 notes on this close. Research talk, not advice.
Sign in to join the thread. Reading is open.
No notes yet. First take on this tape is open.