
Close print
2026-10-15
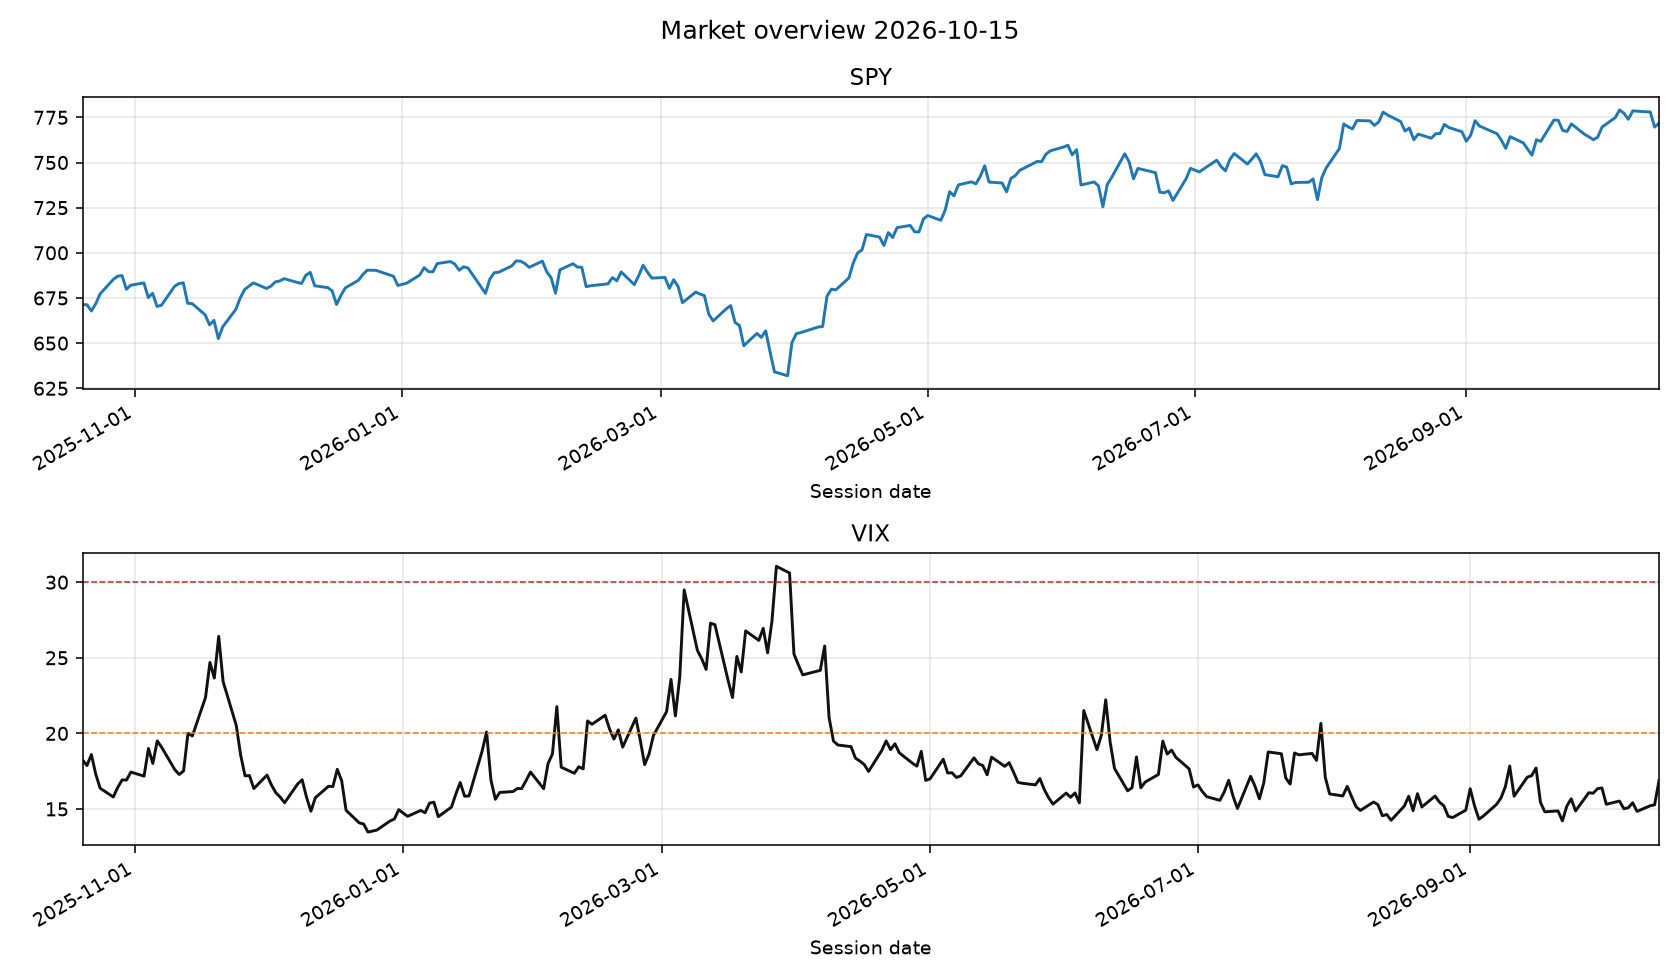
- VIX 16.87 low
- SPY 771.77
- 4 named setups
- Free teaser
Over the measured window — ten years of the local tape, 21 names, onsets spaced so one market phase counts once, and a 10 bps round trip — no named setup beat holding these companies. The unconditional 21-session up-rate was 58.67%. On buy-now versus wait through the next 21 sessions, every setup landed between −0.67% and +0.64% against a random session. One setup clears the publish gate: historic_drawdown at a 61.25% net hit rate on 352 onsets, and its 95% interval bottoms out at 50.33% — a third of a point above a coin. Read that as a gate it passed, not an edge it demonstrated. The desk publishes named setups as context — what happened on the tape — not as timing calls. Scheduled accumulation is the default the evidence supports. The 58.67% figure is not an expected future return: the universe is today's survivors chosen after the fact, which inflates the absolute up-rate.
Desk take
What we think of this print
Close print for 2026-10-15. VIX 16.87 (low) and SPY 771.77 set the tape. Hybrid desk: the scanner names the setup, the model grades that same print, and published conviction is the blend. The model cannot add a name that did not fire.
Amazon.com, Inc. (AMZN)
Scanner what happened: AMZN traded cheaper than its industry peers on trailing P/E at 85/100 (setup 100).
Why it printed:
- Trailing P/E 20.5 is below the internet retail / big-box peer median 28.6 (28% cheaper).
- Market cap still sits above the peer median ($2.75T vs $350.4B).
- Cap is more than 2× the peer median — quality/size filter.
- VIX regime is low (16.87).
- 21d relative strength vs SPY is 1.2%.
- Relative volume 0.89x.
Invalidation: Multiple re-rates up to the peer median P/E, or a daily close back below SMA200; stop ~243.01.
Continuation of the 2026-10-14 alert, not a new one — this is print 2 of one run: the same call went out on 2026-10-14. Today is not a fresh signal; the setup was already true when the desk last printed it. The analog below measures the first session of a run, so its hit rate belongs to 2026-10-14, not to today.
Same-setup analogs on 21 names (n=266, n_eff=84.9, 95% CI 48–68%): 58% 21-session net hit rate against a 59% base rate, average +3.1%, vs SPY +1.3%.
The 95% interval includes 50%, so this is the desk's narrative setup rather than a demonstrated edge.
LLM confirm at 85/100: Amazon presents a solid valuation setup trading at a notable discount to the internet retail and big-box peer median. The market capitalization easily clears quality filters while operating in a low VIX environment. Relative strength is stable, making this a fundamentally sound cheap_vs_industry candidate.
Risk: A multiple re-rating or a breakdown below the 200-day moving average invalidates the trade setup.
NVIDIA Corporation (NVDA)
Scanner what happened: NVDA traded cheaper than its industry peers on trailing P/E at 86/100 (setup 98).
Why it printed:
- Trailing P/E 31.0 is below the semiconductors peer median 39.4 (21% cheaper).
- Market cap still sits above the peer median ($5.25T vs $917.8B).
- Cap is more than 2× the peer median — quality/size filter.
- VIX regime is low (16.87).
- Relative volume 1.12x.
Invalidation: Multiple re-rates up to the peer median P/E, or a daily close back below SMA200; stop ~205.20.
Continuation of the 2026-10-14 alert, not a new one — this is print 10 of one run: the same call has gone out 9 times since 2026-10-02 across 13 calendar days, most recently on 2026-10-14. Today is not a fresh signal; the setup was already true when the desk last printed it. The analog below measures the first session of a run, so its hit rate belongs to 2026-10-02, not to today.
Same-setup analogs on 21 names (n=266, n_eff=84.9, 95% CI 48–68%): 58% 21-session net hit rate against a 59% base rate, average +3.1%, vs SPY +1.3%.
The 95% interval includes 50%, so this is the desk's narrative setup rather than a demonstrated edge.
LLM confirm at 86/100: NVIDIA is flagged under cheap_vs_industry with a trailing P/E comfortably below its semiconductor peers. Elevated relative volume confirms institutional participation during this constructive consolidation. The large market capitalization provides a strong quality buffer.
Risk: Failure to hold above the 200-day moving average or a sharp sector correction invalidates the thesis.
Taiwan Semiconductor (TSM)
Scanner what happened: TSM traded cheaper than its industry peers on trailing P/E at 86/100 (setup 98).
Why it printed:
- Trailing P/E 27.2 is below the semiconductors peer median 48.9 (44% cheaper).
- Market cap still sits above the peer median ($2.19T vs $917.8B).
- Cap is more than 2× the peer median — quality/size filter.
- VIX regime is low (16.87).
- Relative volume 2.03x.
Invalidation: Multiple re-rates up to the peer median P/E, or a daily close back below SMA200; stop ~397.92.
Continuation of the 2026-10-14 alert, not a new one — this is print 7 of one run: the same call has gone out 6 times since 2026-10-07 across 8 calendar days, most recently on 2026-10-14. Today is not a fresh signal; the setup was already true when the desk last printed it. The analog below measures the first session of a run, so its hit rate belongs to 2026-10-07, not to today.
Same-setup analogs on 21 names (n=266, n_eff=84.9, 95% CI 48–68%): 58% 21-session net hit rate against a 59% base rate, average +3.1%, vs SPY +1.3%.
The 95% interval includes 50%, so this is the desk's narrative setup rather than a demonstrated edge.
LLM confirm at 86/100: Taiwan Semiconductor displays a compelling cheap_vs_industry setup with a massive P/E discount to the broader semiconductor group. Relative volume is exceptionally high at over two times average, signaling strong accumulation. The large cap size meets all stringent quality parameters.
Risk: Geopolitical overhangs or a close beneath the 200-day moving average invalidates the setup.
Texas Instruments (TXN)
Scanner what happened: TXN pulled back to its 20-day average inside an uptrend at 79/100 (setup 90).
Why it printed:
- Price above SMA50 and SMA50 above SMA200 (bullish regime).
- VIX regime is low (16.87).
- RSI_14=50.0 is a reset, not a chase.
- Close is -0.8% from SMA20 (pullback/tag).
- 21d relative strength vs SPY is 4.7%.
- Relative volume 1.14x.
Invalidation: Stop ~262.35 (2x ATR) or daily close back below SMA50.
Continuation of the 2026-10-14 alert, not a new one — this is print 2 of one run: the same call went out on 2026-10-14. Today is not a fresh signal; the setup was already true when the desk last printed it. The analog below measures the first session of a run, so its hit rate belongs to 2026-10-14, not to today.
Same-setup analogs on 21 names (n=1021, n_eff=113.7, 95% CI 51–68%): 60% 21-session net hit rate against a 59% base rate, average +2.8%, vs SPY +1.5%.
The 95% interval includes 50%, so this is the desk's narrative setup rather than a demonstrated edge.
LLM confirm at 79/100: Texas Instruments is captured cleanly within a pullback_in_uptrend framework with moving averages properly stacked in a bullish regime. An RSI reading near 50 represents a healthy reset rather than momentum chasing. Strong 21-day relative strength underpins the overall continuation thesis.
Risk: A daily close breaking below the 50-day moving average invalidates the bullish trend structure.
Analog Devices (ADI)
Scanner what happened: ADI pulled back to its 20-day average inside an uptrend at 79/100 (setup 90).
Why it printed:
- Price above SMA50 and SMA50 above SMA200 (bullish regime).
- VIX regime is low (16.87).
- RSI_14=56.0 is a reset, not a chase.
- Close is 0.8% from SMA20 (pullback/tag).
- 21d relative strength vs SPY is 9.2%.
- Relative volume 1.40x.
Invalidation: Stop ~380.48 (2x ATR) or daily close back below SMA50.
Same-setup analogs on 21 names (n=1021, n_eff=113.7, 95% CI 51–68%): 60% 21-session net hit rate against a 59% base rate, average +2.8%, vs SPY +1.5%.
The 95% interval includes 50%, so this is the desk's narrative setup rather than a demonstrated edge.
LLM confirm at 79/100: Analog Devices shows robust characteristics for a pullback_in_uptrend setup supported by strong 21-day relative strength against the S&P 500. The RSI at 56 indicates a mild pullback without breaking the underlying momentum. Relative volume is elevated, confirming active buyer interest at these levels.
Risk: Loss of the 50-day moving average support or a broader tech pullback invalidates the trade.
Micron Technology (MU)
Scanner what happened: MU traded cheaper than its industry peers on trailing P/E at 80/100 (setup 90).
Why it printed:
- Trailing P/E 12.3 is below the semiconductors peer median 65.0 (81% cheaper).
- Market cap still sits above the peer median ($1.05T vs $711.0B).
- VIX regime is low (16.87).
- Relative volume 1.32x.
Invalidation: Multiple re-rates up to the peer median P/E, or a daily close back below SMA200; stop ~833.94.
Continuation of the 2026-10-14 alert, not a new one — this is print 10 of one run: the same call has gone out 9 times since 2026-10-02 across 13 calendar days, most recently on 2026-10-14. Today is not a fresh signal; the setup was already true when the desk last printed it. The analog below measures the first session of a run, so its hit rate belongs to 2026-10-02, not to today.
Same-setup analogs on 21 names (n=266, n_eff=84.9, 95% CI 48–68%): 58% 21-session net hit rate against a 59% base rate, average +3.1%, vs SPY +1.3%.
The 95% interval includes 50%, so this is the desk's narrative setup rather than a demonstrated edge.
LLM confirm at 80/100: Micron Technology offers an aggressive cheap_vs_industry setup with a P/E multiple heavily discounted relative to semiconductor peers. The massive market cap acts as a primary quality filter in a low volatility regime. Volume is expanding nicely on the recent prints.
Risk: A breakdown under the 200-day moving average serves as the strict stop-loss level.
Meta Platforms, Inc. (META)
Scanner what happened: META pulled back to its 20-day average inside an uptrend at 75/100 (setup 85).
Why it printed:
- Price above SMA50 and SMA50 above SMA200 (bullish regime).
- VIX regime is low (16.87).
- RSI_14=57.9 is a reset, not a chase.
- Close is 0.4% from SMA20 (pullback/tag).
- 21d relative strength vs SPY is 7.1%.
Invalidation: Stop ~687.75 (2x ATR) or daily close back below SMA50.
Continuation of the 2026-10-08 alert, not a new one — this is print 2 of one run: the same call went out on 2026-10-08. Today is not a fresh signal; the setup was already true when the desk last printed it. The analog below measures the first session of a run, so its hit rate belongs to 2026-10-08, not to today.
Same-setup analogs on 21 names (n=1021, n_eff=113.7, 95% CI 51–68%): 60% 21-session net hit rate against a 59% base rate, average +2.8%, vs SPY +1.5%.
The 95% interval includes 50%, so this is the desk's narrative setup rather than a demonstrated edge.
LLM confirm at 75/100: Meta Platforms exhibits a textbook pullback_in_uptrend pattern within a healthy bullish moving average structure. The RSI reading near 58 provides a sensible entry following a minor tag of the 20-day moving average. Strong relative strength over the past month reinforces the setup.
Risk: A daily close back below the 50-day moving average invalidates the continuation pattern.
KLA (KLAC)
Scanner what happened: KLAC sat in a deep drawdown during VIX stress at 71/100 (setup 78).
Why it printed:
- Close is -43.2% from the 52-week high — a deep drawdown.
- Drawdown reaches 35% from the high.
- Drawdown is at least the mean of this name's largest completed pullbacks (37.9%).
- Trailing P/E is 3% cheaper than the industry-peer median.
- TTM EPS is still growing through the drawdown (12.9% YoY).
Invalidation: Stop ~158.34 (2x ATR) or TTM earnings turning negative.
Continuation of the 2026-10-13 alert, not a new one — this is print 2 of one run: the same call went out on 2026-10-13. Today is not a fresh signal; the setup was already true when the desk last printed it. The analog below measures the first session of a run, so its hit rate belongs to 2026-10-13, not to today.
Same-setup analogs on 21 names (n=221, n_eff=58.2, 95% CI 50–74%): 63% 21-session net hit rate against a 59% base rate, average +3.6%, vs SPY +1.4%.
The 95% interval includes 50%, so this is the desk's narrative setup rather than a demonstrated edge.
LLM confirm at 71/100: KLA qualifies for a deep_drawdown_value setup after experiencing a severe correction exceeding historical pullback means. Crucially, TTM earnings per share continue to expand year-over-year despite the steep price drawdown. This combination of deep value and ongoing earnings growth makes the observation valid.
Risk: Deterioration in trailing twelve-month earnings or a breach of the ATR-based stop invalidates the thesis.
Alphabet Inc. (GOOGL)
Scanner what happened: GOOGL traded cheaper than its industry peers on trailing P/E at 68/100 (setup 76).
Why it printed:
- Trailing P/E 17.5 is below the interactive media peer median 18.2 (3% cheaper).
- Market cap still sits above the peer median ($2.05T vs $9.9B).
- Cap is more than 2× the peer median — quality/size filter.
- VIX regime is low (16.87).
Invalidation: Multiple re-rates up to the peer median P/E, or a daily close back below SMA200; stop ~331.82.
Same-setup analogs on 21 names (n=266, n_eff=84.9, 95% CI 48–68%): 58% 21-session net hit rate against a 59% base rate, average +3.1%, vs SPY +1.3%.
The 95% interval includes 50%, so this is the desk's narrative setup rather than a demonstrated edge.
LLM haircut at 68/100: Alphabet meets the strict criteria for the cheap_vs_industry setup, though the P/E discount to peers is relatively narrow. The market capitalization easily passes quality screens in a low VIX tape. However, lackluster relative volume and neutral momentum suggest a less urgent entry compared to peers.
Risk: A close below the 200-day moving average invalidates the value proposition.
Advanced Micro Devices (AMD)
Scanner what happened: AMD pulled back to its 20-day average inside an uptrend at 68/100 (setup 75).
Why it printed:
- Price above SMA50 and SMA50 above SMA200 (bullish regime).
- VIX regime is low (16.87).
- RSI_14=44.5 is a reset, not a chase.
- 21d relative strength vs SPY is 7.4%.
- Relative volume 1.29x.
Invalidation: Stop ~508.94 (2x ATR) or daily close back below SMA50.
Continuation of the 2026-10-13 alert, not a new one — this is print 2 of one run: the same call went out on 2026-10-13. Today is not a fresh signal; the setup was already true when the desk last printed it. The analog below measures the first session of a run, so its hit rate belongs to 2026-10-13, not to today.
Same-setup analogs on 21 names (n=1021, n_eff=113.7, 95% CI 51–68%): 60% 21-session net hit rate against a 59% base rate, average +2.8%, vs SPY +1.5%.
The 95% interval includes 50%, so this is the desk's narrative setup rather than a demonstrated edge.
LLM confirm at 68/100: Advanced Micro Devices aligns well with the pullback_in_uptrend rules, backed by positive relative strength and a constructive moving average hierarchy. An RSI near 44 offers an appealing reset in a strong secular trend. Relative volume is supportive of continued accumulation.
Risk: Failure to maintain the 50-day moving average breaks the trend structure.
Qualcomm (QCOM)
Scanner what happened: QCOM pulled back to its 20-day average inside an uptrend at 68/100 (setup 75).
Why it printed:
- Price above SMA50 and SMA50 above SMA200 (bullish regime).
- VIX regime is low (16.87).
- RSI_14=48.9 is a reset, not a chase.
- Close is -3.0% from SMA20 (pullback/tag).
- Relative volume 0.82x.
Invalidation: Stop ~163.81 (2x ATR) or daily close back below SMA50.
Continuation of the 2026-10-05 alert, not a new one — this is print 3 of one run: the same call has gone out twice since 2026-10-02 across 13 calendar days, most recently on 2026-10-05. Today is not a fresh signal; the setup was already true when the desk last printed it. The analog below measures the first session of a run, so its hit rate belongs to 2026-10-02, not to today.
Same-setup analogs on 21 names (n=1021, n_eff=113.7, 95% CI 51–68%): 60% 21-session net hit rate against a 59% base rate, average +2.8%, vs SPY +1.5%.
The 95% interval includes 50%, so this is the desk's narrative setup rather than a demonstrated edge.
LLM haircut at 68/100: Qualcomm prints a valid pullback_in_uptrend setup, but underperforms peers given negative 21-day relative strength against the S&P 500. Relative volume is also subdued below average levels. While the technical structure remains intact, the lack of relative momentum lowers overall conviction.
Risk: A daily close under the 50-day moving average invalidates the setup.
Marvell Technology (MRVL)
Scanner what happened: MRVL pulled back to its 20-day average inside an uptrend at 68/100 (setup 75).
Why it printed:
- Price above SMA50 and SMA50 above SMA200 (bullish regime).
- VIX regime is low (16.87).
- RSI_14=42.7 is a reset, not a chase.
- 21d relative strength vs SPY is 2.7%.
- Relative volume 1.14x.
Invalidation: Stop ~209.32 (2x ATR) or daily close back below SMA50.
Same-setup analogs on 21 names (n=1021, n_eff=113.7, 95% CI 51–68%): 60% 21-session net hit rate against a 59% base rate, average +2.8%, vs SPY +1.5%.
The 95% interval includes 50%, so this is the desk's narrative setup rather than a demonstrated edge.
LLM confirm at 68/100: Marvell Technology fits the pullback_in_uptrend criteria cleanly with bullish moving average alignment and positive relative strength. The RSI reset near 42 provides a favorable risk-reward entry zone. Volume metrics confirm steady underlying participation.
Risk: A breakdown beneath the 50-day moving average invalidates the bullish thesis.
Applied Materials (AMAT)
Scanner what happened: AMAT sat in a deep drawdown during VIX stress at 63/100 (setup 68).
Why it printed:
- Close is -41.9% from the 52-week high — a deep drawdown.
- Drawdown reaches 35% from the high.
- RSI_14=32.9 is washed out.
- Trailing P/E is 17% cheaper than the industry-peer median.
- TTM EPS is still growing through the drawdown (14.0% YoY).
Invalidation: Stop ~388.44 (2x ATR) or TTM earnings turning negative.
Same-setup analogs on 21 names (n=221, n_eff=58.2, 95% CI 50–74%): 63% 21-session net hit rate against a 59% base rate, average +3.6%, vs SPY +1.4%.
The 95% interval includes 50%, so this is the desk's narrative setup rather than a demonstrated edge.
LLM confirm at 63/100: Applied Materials qualifies for a deep_drawdown_value setup with a washed-out RSI and a correction exceeding historical pullback thresholds. Earnings growth remains positive year-over-year through the drawdown, providing fundamental backing. High relative volume indicates heavy institutional turnover at these depressed prices.
Risk: Negative revisions to trailing earnings or a breach of the stop-loss level invalidates the trade.
Apple Inc. (AAPL)
Scanner what happened: AAPL closed near a 52-week high at 60/100 (setup 65).
Why it printed:
- Within 1.8% of 52-week high.
- Still in a bullish SMA regime.
- Beating SPY by 0.5% over 21d.
- VIX regime low.
Invalidation: Failed breakout if close back below prior 52w high and stop ~328.70.
Same-setup analogs on 21 names (n=738, n_eff=100.8, 95% CI 49–68%): 58% 21-session net hit rate against a 59% base rate, average +2.8%, vs SPY +1.8%.
The 95% interval includes 50%, so this is the desk's narrative setup rather than a demonstrated edge.
LLM haircut at 60/100: Apple registers a breakout setup near its 52-week highs within a broader bull market regime. Relative strength is modestly positive, though volume is slightly below average. The setup is technically correct but lacks the explosive momentum seen in stronger leaders.
Risk: A failed breakout occurring on a daily close back below prior resistance invalidates the setup.
Microsoft Corporation (MSFT)
Scanner what happened: MSFT closed near a 52-week high at 60/100 (setup 65).
Why it printed:
- Within 2.6% of 52-week high.
- Still in a bullish SMA regime.
- Beating SPY by 7.7% over 21d.
- VIX regime low.
Invalidation: Failed breakout if close back below prior 52w high and stop ~516.56.
Same-setup analogs on 21 names (n=738, n_eff=100.8, 95% CI 49–68%): 58% 21-session net hit rate against a 59% base rate, average +2.8%, vs SPY +1.8%.
The 95% interval includes 50%, so this is the desk's narrative setup rather than a demonstrated edge.
LLM confirm at 60/100: Microsoft shows a high-quality breakout setup near 52-week highs supported by robust 21-day relative strength against the index. The moving average regime is decisively bullish, and the stock is showing strong leadership characteristics. Momentum indicators remain elevated but constructive.
Risk: A failed breakout closing back below previous 52-week high resistance invalidates the trade.
Lam Research (LRCX)
Scanner what happened: LRCX sat in a deep drawdown during VIX stress at 57/100 (setup 60).
Why it printed:
- Close is -36.7% from the 52-week high — a deep drawdown.
- Drawdown reaches 35% from the high.
- RSI_14=34.2 is washed out.
- TTM EPS is still growing through the drawdown (40.6% YoY).
Invalidation: Stop ~248.65 (2x ATR) or TTM earnings turning negative.
Same-setup analogs on 21 names (n=221, n_eff=58.2, 95% CI 50–74%): 63% 21-session net hit rate against a 59% base rate, average +3.6%, vs SPY +1.4%.
The 95% interval includes 50%, so this is the desk's narrative setup rather than a demonstrated edge.
LLM confirm at 57/100: Lam Research triggers a deep_drawdown_value setup backed by significant price correction and a washed-out RSI reading. Impressively, TTM EPS growth remains extremely robust despite the steep decline in valuation. Elevated relative volume suggests capitulation selling is finding willing buyers.
Risk: A sudden turn in earnings growth or failure to hold structural support invalidates the setup.
Overall: scanner and model agree on the named prints. They can still fail; the analog table is research history, not a forecast.
RESEARCH ONLY — not advice.
Scanner names what happened on the tape. The model grades that observation. Hybrid conviction is what publishes. The model cannot add a name that did not fire. Research only — not a timing call.
add reminders
Five add reminders
Live add reminders: K1, K2, K3, K4, and K5. Exclusive listing, strongest first. K6, K7, K8, K9, and K10 repeat those shapes on the name's industry tape and can print on the same close. K11 and K12 are that name's own RSI and can print on the same close. Not a named setup. Does not score. Now vs 52w is close versus the 252-session high. This-name median is that same drawdown on this ticker's prior fires of the same gate.
Quiet today: K1 Weekly RSI (fear) · K2 Weekly RSI (elevated) · K3 Daily RSI (fear) · K4 Daily RSI (elevated) · K5 Daily RSI (calm) · K6 Weekly RSI (industry stress) · K7 Weekly RSI (industry elevated) · K8 Daily RSI (industry stress) · K9 Daily RSI (industry elevated) · K10 Daily RSI (industry calm) · K11 Weekly RSI · K12 Daily RSI.
Quiet watch: no desk name is approaching. VIX must already be 30.
NVDA NVDA traded cheaper than its industry peers on trailing P/E
Hybrid 86/100 · buy · named setup cheap vs industry
Scanner 86/100 LLM confirm 86/100
NVIDIA is flagged under cheap_vs_industry with a trailing P/E comfortably below its semiconductor peers. Elevated relative volume confirms institutional participation during this constructive consolidation. The large market capitalization provides a strong quality buffer.
Multiple re-rates up to the peer median P/E, or a daily close back below SMA200; stop ~205.20.
- Close
- 217.23
- vs SMA20
- -5.0%
- RSI 14
- 40.2
- Stop
- 205.20
Pattern readings
| Pattern | Current | Threshold | vs | Status |
|---|---|---|---|---|
| Historic drawdown | 9.2% | >= top-3 avg 53.3% | 0.17x | below |
| 20d range high | 217.23 | > 243.37 | -10.7% | below |
| 20d range low | 217.23 | < 217.15 | +0.0% | below |
| Relative volume | 1.12x | >= 1.50x expansion / <= 0.70x dry-up | 0.75x vs expansion | below |
| RSI_14 | 40.2 | oversold < 30 · reset 35-58 · overbought > 70 | mid 30-70 | inside |
| MACD vs signal | 0.914 vs 2.770 | cross up: line > signal after line <= signal | spread -1.856 | below |
| Bollinger squeeze | width 9.627 | <= 20%ile cutoff 11.032 | 0.87x cutoff | met |
| vs SMA20 (pullback tag) | -5.0% | -4.0% to +1.2% | -5.0% | outside |
| vs 52w high (breakout) | -10.7% | >= -3.0% (within 3% of high) | -10.7% | below |
| SMA50 vs SMA200 | 223.17 vs 202.84 | golden: 50 > 200 · death: 50 < 200 | +10.0% | above |
| VIX | 16.87 (low) | elevated >= 20 · stress >= 30 | 16.87 | low |
Similar-setup analog
cheap vs industry onset · 266 samples · last 2300 sessions (publish window). What happened on similar days — not a forecast.
| Horizon | n | Hit rate | Base rate | Avg | vs SPY | Beat SPY |
|---|---|---|---|---|---|---|
| 5d | 266 | 57% | 55% | +0.9% | +0.5% | 56% |
| 10d | 265 | 59% | 56% | +1.9% | +0.8% | 52% |
| 21d | 263 | 58% | 59% | +3.1% | +1.3% | 53% |
| 63d | 260 | 65% | 63% | +9.7% | +5.7% | 58% |
| 126d | 251 | 68% | 68% | +17.7% | +10.4% | 59% |
Hit rate is shown next to the 21-session base rate so the comparison is unavoidable. The ~60% absolute up-rate is not an expected future return: the universe is today's winners chosen after the fact. Beat SPY is how often one trade finished ahead of the index; the SPY columns carry no trading cost because buying the index pays the same round trip.
3 more names behind the desk pass
- TSM cheap vs industry · 86/100
- AMZN cheap vs industry · 85/100
- MU cheap vs industry · 80/100
Print board
Discussion
0 notes on this close. Research talk, not advice.
Sign in to join the thread. Reading is open.
No notes yet. First take on this tape is open.