
Close print
2026-09-11
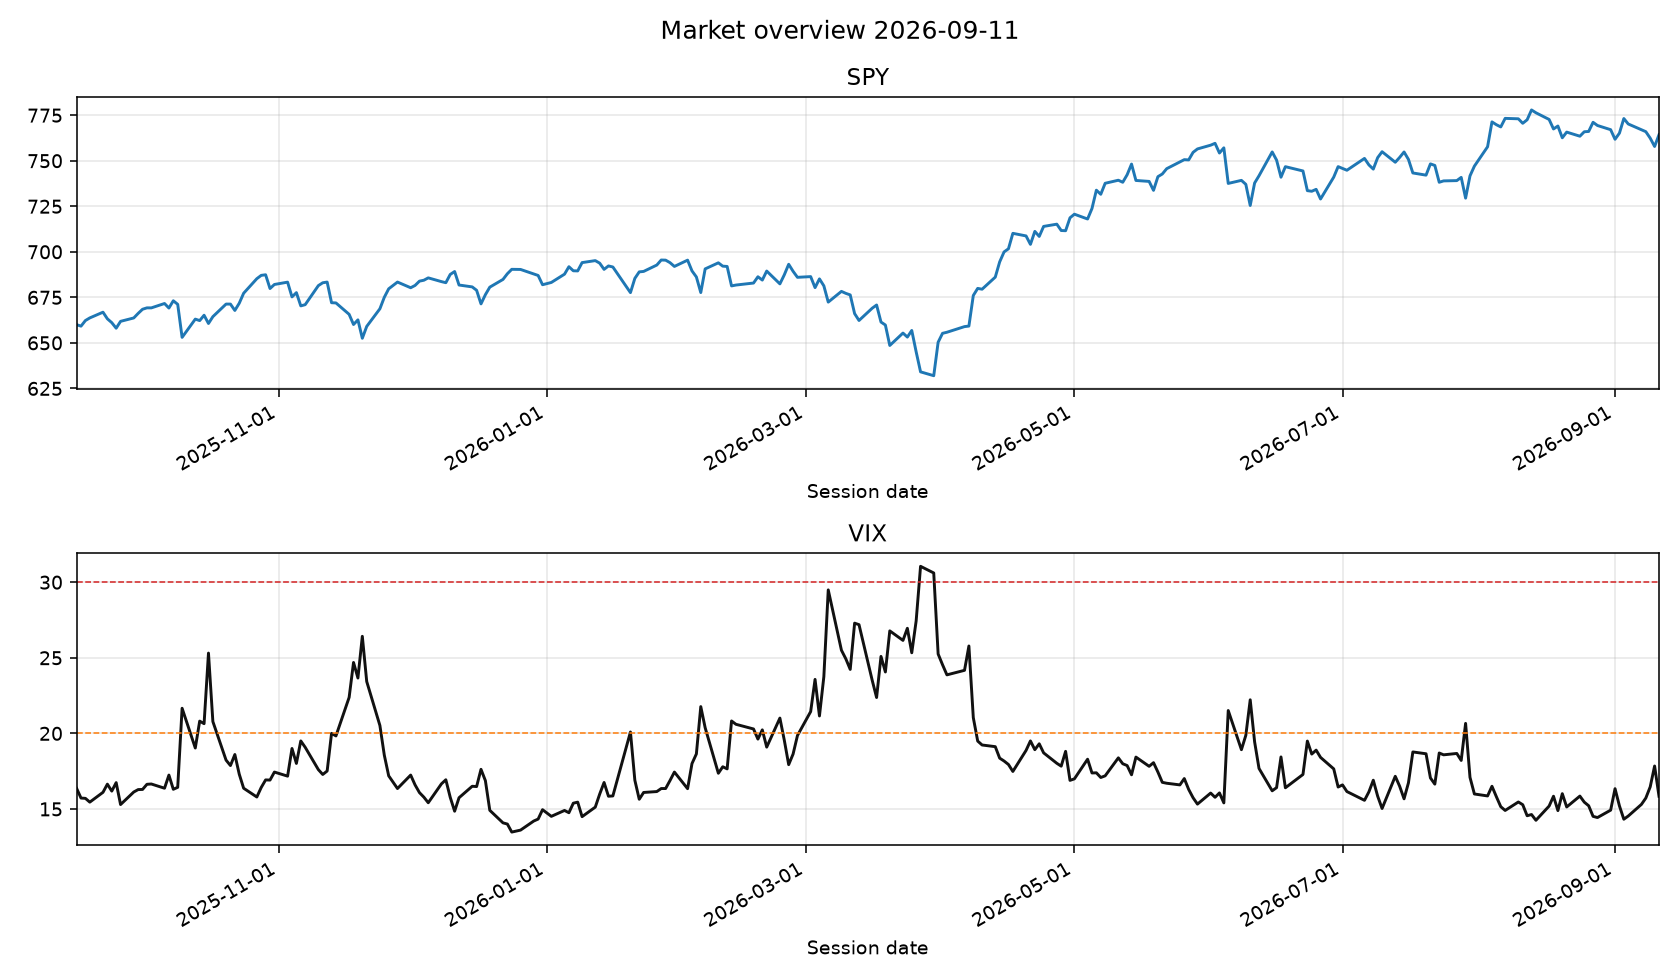
- VIX 15.84 low
- SPY 764.29
- 1 named setups
- Free teaser
Over the measured window — ten years of the local tape, 21 names, onsets spaced so one market phase counts once, and a 10 bps round trip — no named setup beat holding these companies. The unconditional 21-session up-rate was 58.67%. On buy-now versus wait through the next 21 sessions, every setup landed between −0.67% and +0.64% against a random session. One setup clears the publish gate: historic_drawdown at a 61.25% net hit rate on 352 onsets, and its 95% interval bottoms out at 50.33% — a third of a point above a coin. Read that as a gate it passed, not an edge it demonstrated. The desk publishes named setups as context — what happened on the tape — not as timing calls. Scheduled accumulation is the default the evidence supports. The 58.67% figure is not an expected future return: the universe is today's survivors chosen after the fact, which inflates the absolute up-rate.
add reminders
Five add reminders
Live add reminders. Exclusive listing, strongest first. Not a named setup. Does not score. Now vs 52w is close versus the 252-session high. This-name median is that drawdown on this ticker's prior fires of the same gate.
Quiet today: K1 Weekly RSI (fear) · K2 Weekly RSI (elevated) · K3 Daily RSI (fear) · K4 Daily RSI (elevated) · K5 Daily RSI (calm) · K6 Weekly RSI (industry stress) · K7 Weekly RSI (industry elevated) · K8 Daily RSI (industry stress) · K9 Daily RSI (industry elevated) · K10 Daily RSI (industry calm) · K11 Weekly RSI · K12 Daily RSI.
Quiet watch: no desk name is approaching. VIX must already be 30.
MSFT MSFT pulled back to its 20-day average inside an uptrend
Hybrid /100 · buy · named setup pullback in uptrend
Stop ~474.30 (2x ATR) or daily close back below SMA50.
- Close
- 495.63
- vs SMA20
- +0.2%
- RSI 14
- 56.7
- Stop
- 474.30
Pattern readings
| Pattern | Current | Threshold | vs | Status |
|---|---|---|---|---|
| 20d range high | 495.63 | > 517.78 | -4.3% | below |
| 20d range low | 495.63 | < 477.15 | +3.9% | below |
| Relative volume | 0.70x | >= 1.50x expansion / <= 0.70x dry-up | 0.47x vs expansion | dry-up |
| RSI_14 | 56.7 | oversold < 30 · reset 35-58 · overbought > 70 | mid 30-70 | inside |
| MACD vs signal | 10.170 vs 14.005 | cross up: line > signal after line <= signal | spread -3.836 | below |
| vs SMA20 (pullback tag) | +0.2% | -4.0% to +1.2% | +0.2% | met |
| vs 52w high (breakout) | -10.5% | >= -3.0% (within 3% of high) | -10.5% | below |
| SMA50 vs SMA200 | 453.67 vs 431.26 | golden: 50 > 200 · death: 50 < 200 | +5.2% | above |
| VIX | 15.84 (low) | elevated >= 20 · stress >= 30 | 15.84 | low |
| RSI bearish divergence | price 506.06 → 513.53 · osc 79.14 → 73.07 | price higher high AND oscillator lower high | price +1.5% · osc -6.07 | met |
| MACD bearish divergence | price 506.06 → 513.53 · osc 10.50 → -1.23 | price higher high AND oscillator lower high | price +1.5% · osc -11.72 | met |
Similar-setup analog
pullback in uptrend onset · 206 samples · last 504 sessions. What happened on similar days — not a forecast.
| Horizon | n | Hit rate | Base rate | Avg | vs SPY | Beat SPY |
|---|---|---|---|---|---|---|
| 5d | 205 | 51% | 58.67% | +0.3% | +0.1% | — |
| 10d | 204 | 50% | 58.67% | +0.7% | +0.2% | — |
| 21d | 202 | 56% | 58.67% | +2.2% | +0.9% | — |
Hit rate is shown next to the 21-session base rate so the comparison is unavoidable. The ~60% absolute up-rate is not an expected future return: the universe is today's winners chosen after the fact. Beat SPY is how often one trade finished ahead of the index; the SPY columns carry no trading cost because buying the index pays the same round trip.
Print board
Discussion
0 notes on this close. Research talk, not advice.
Sign in to join the thread. Reading is open.
No notes yet. First take on this tape is open.